Breakout Trading Strategy: Catching the Moment a Market Breaks Out
Breakout trading is a strategy of entering in the direction of the trend when price forces its way out of a consolidation range. The core logic is that once the energy the market has built up is released, it usually continues rather than reversing immediately. Unlike trend following, which enters on a pullback, breakout trading requires you to act the moment price breaks a key resistance or support level on strong volume. The key is not predicting the market but judging the quality of the breakout — whether it is real or fake often decides whether the trade catches a trend or leaves you stuck in a bull trap.
What Is a Breakout? Understanding the Market's "Spring Effect"
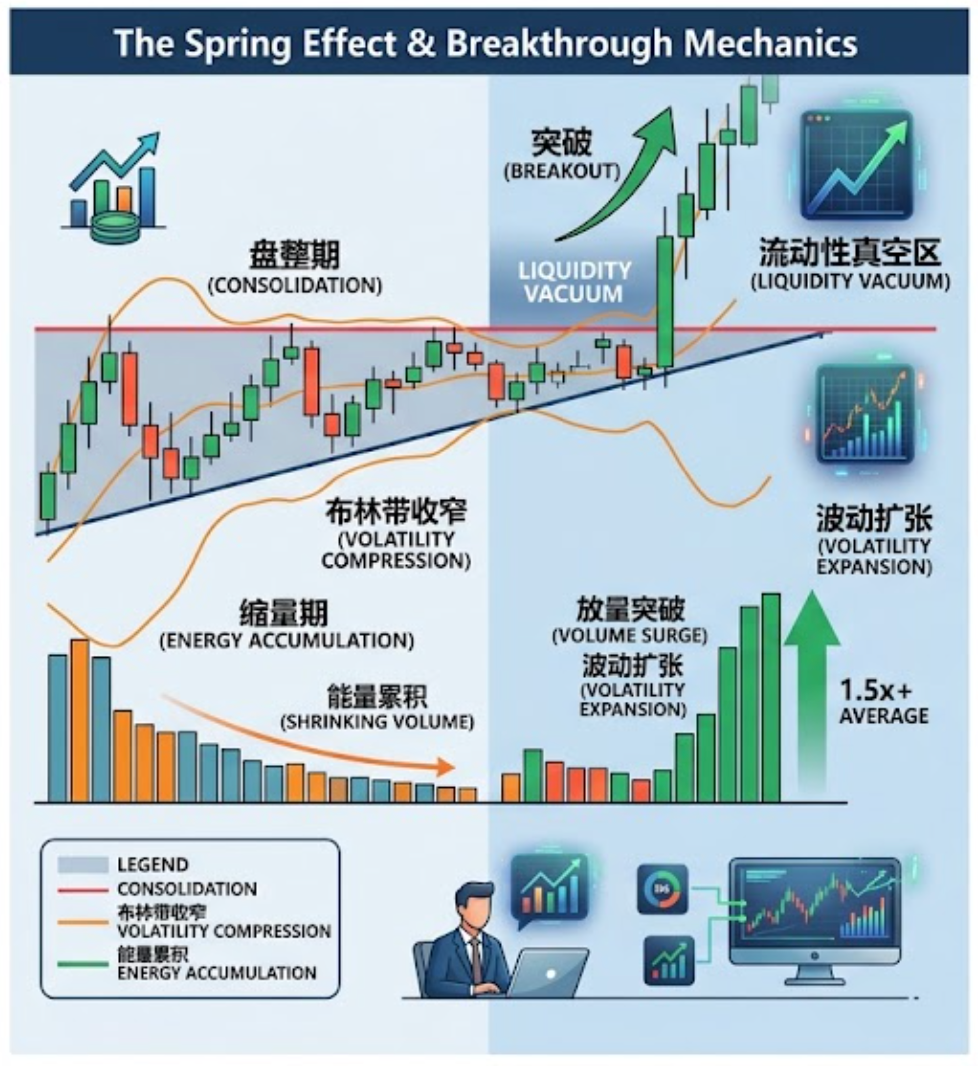
When price oscillates repeatedly between support and resistance, the market enters a consolidation phase in which buyers and sellers are temporarily balanced. Over time energy keeps accumulating until one side breaks the balance — that is a breakout.
Breakout to the upside in an uptrend: price clears a key resistance level with strong momentum, meaning buyers are in control and a new leg up may open.
Breakout to the downside in a downtrend: price falls below a key support level, meaning sellers are in control and further declines may follow.
When a breakout happens, the market usually goes through a full cycle: compression and shrinking volume, then the price breakout, then volatility expansion. During consolidation, Bollinger Bands narrow and price swings compress to extremely low levels; after the breakout, price quickly enters a "liquidity vacuum" where almost nothing blocks the momentum.
True Breakout vs. Fake Breakout: Four Key Confirmation Methods
The biggest risk in breakout trading is a fake breakout — price briefly pierces resistance and then falls back quickly, trapping the traders who chased it. Telling the two apart is the core skill of any breakout strategy.
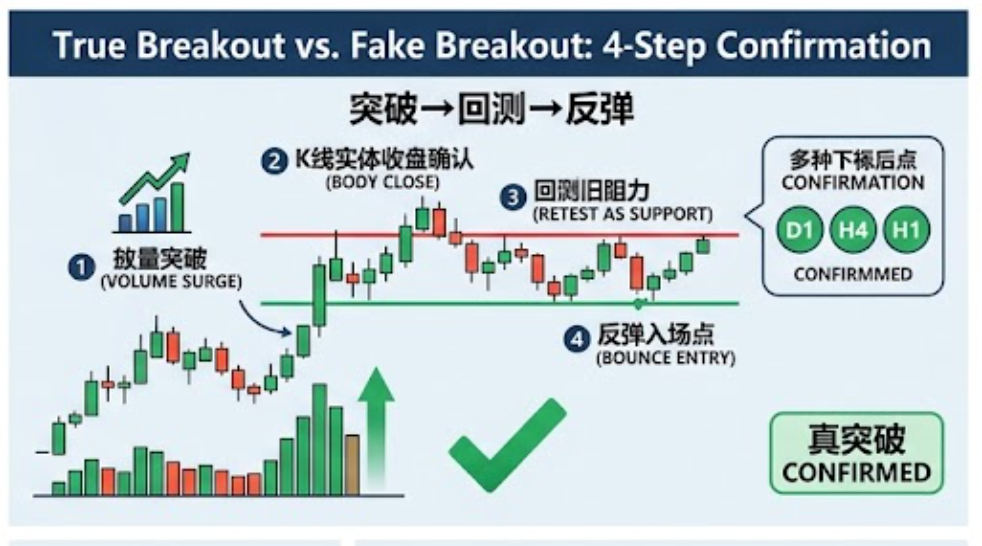
Volume confirmation (most important): a real breakout must come with a clear jump in volume (usually at least 1.5x the average), which shows that large players are taking part in the move. A breakout on low or shrinking volume is most likely fake or a brief bull trap.
Candlestick body confirmation: wait for the candle to close completely above resistance. A wick that merely pierces the level is not a valid breakout; only a body closing clearly above the key level confirms that the breakout has some follow-through.
Retest confirmation (the core method for professional traders): after breaking out, price often pulls back to the old resistance level, which should now act as new support. If price finds support in that area and bounces, the breakout is confirmed and the entry carries a very high probability. Many successful traders treat "breakout, retest, bounce" as the standard entry framework for breakout trading.
Multi-timeframe alignment: a breakout signal on the 4-hour or daily chart carries far more weight than one on the 15-minute chart. When charts on several timeframes confirm a breakout in the same direction at once, the reliability of the signal improves noticeably.
How to Choose the Right Asset for Breakout Trading
Not every asset suits a breakout strategy. Both of the following conditions are essential:
Enough volatility: price must swing widely enough to produce genuine trend extension. Major coins such as BTC and ETH perform well here, while stablecoins and low-volatility altcoins do not.
Enough liquidity: an actively traded asset shows cleaner price action and is harder to manipulate with a few large orders, which reduces distorted signals.
A Practical Framework for Breakout Trading
Entry Point
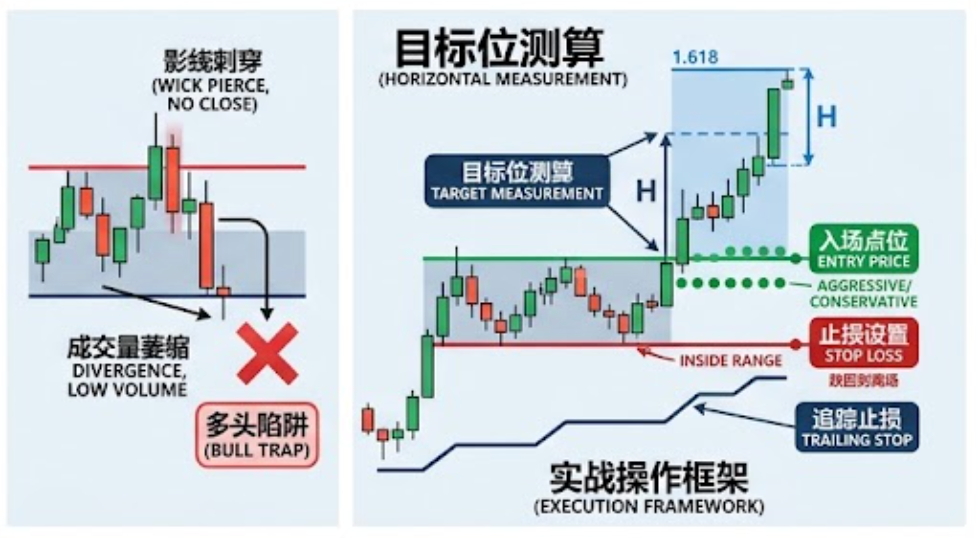
Aggressive approach: enter directly once price breaks resistance on strong volume and the candle body closes with confirmation.
Conservative approach (recommended for beginners): wait for price to break out, then retest the old resistance level (now support) and enter on the bounce. This gives a better entry and a tighter stop.
Stop-Loss Placement
Place the stop just inside the previous consolidation range or below support, and keep the distance reasonable. If price falls back inside the range, the breakout has failed and you must exit decisively.
Measuring the Target
Horizontal measurement: use the height of the consolidation range as the reference target — as wide as the range is, that is how far the theoretical target after the breakout lies.
Fibonacci extension: use tools such as the 1.618 extension level to set a mathematical target.
Trailing stop: instead of setting a fixed take-profit for a breakout trade, use a trailing stop (for example, exit when price retraces 3% from its high) so that profits keep running with the trend.
Key Risks and Common Mistakes
Mistake 1: chasing as soon as price "touches" resistance. The first rule of breakout trading is to wait for the candle to close and confirm. Price very often touches resistance and then falls back, so entering too early leaves you trapped by a fake breakout.
Mistake 2: ignoring volume. A breakout without volume has no support from large players behind it and is most likely a bull trap.
Mistake 3: using a breakout strategy constantly in a ranging market. Breakout strategies work best during sideways consolidation or in the early stage of a trend change. In a persistently ranging market, price keeps producing fake breakouts and stops you out again and again.
Frequently Asked Questions (FAQ)
Q1: What is the difference between breakout trading and trend trading?
Trend trading lets you buy on a pullback, which gives a better entry; breakout trading requires you to act the moment price breaks a key level, which gives a worse entry but greater certainty. Both serve the goal of trading with the trend; only the timing of the entry differs.
Q2: How can technical indicators confirm breakout quality?
RSI can confirm the direction of momentum (on a breakout, RSI should rise above 50 without entering overbought territory), a MACD golden cross can confirm a change in trend direction, and a Bollinger Band breakout can confirm that volatility is expanding. When several indicators confirm at once, the signal is more reliable.
Q3: What should I do after a fake breakout?
Follow your stop-loss discipline strictly. When price falls back inside the original consolidation range and cannot close back above the level, the breakout has failed and you should cut the loss and exit. Do not hold on in the hope that it "just needs a bit more time" — a fake breakout is often followed by a deeper pullback.
Related tutorials:
Volume Analysis: What Price and Volume Reveal About Big Players
Trend Following Strategy: A Repeatable Way to Trade with the Trend
Recommended reading:
Recommended
View more