Cup and Handle Pattern: Capturing Breakout Moves
The Cup and Handle is one of technical analysis's better-known bullish continuation patterns. Technical analyst William J. O'Neil systematized the concept in the 1980s. It consists of a rounded U-shaped base, or cup, followed by a smaller consolidation on the right, or handle. When price breaks above the handle's resistance on expanding volume, a new advance may be starting. In the fast-moving crypto market, recognizing this structure can help breakout traders identify higher-probability opportunities.
What Is a Cup and Handle Pattern?
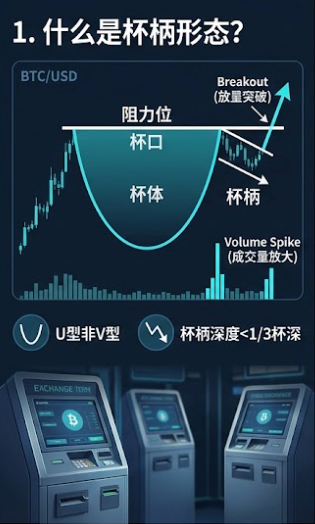
The Cup and Handle is a chart structure resembling a teacup with a handle on its right side. It has two main components:
Cup: After an advance, price gradually declines and recovers, forming a smooth U-shaped base. It should not look like a sharp V. A rounded bottom suggests an orderly, healthy consolidation rather than panic selling. The cup usually develops over several weeks or months, although crypto's 24/7 market can sometimes produce it more quickly.
Handle: After price returns near the cup's rim, it makes a modest pullback or moves sideways. An ideal handle is shallow, retracing no more than one-third of the cup's depth, and stays in the upper half of the cup—preferably the upper third. The handle can be viewed as a final shakeout before the breakout, removing weaker holders and reducing overhead supply.
The pattern is complete and confirmed when price breaks above the handle's resistance with increased volume, potentially triggering a new advance.
Market Psychology Behind the Pattern
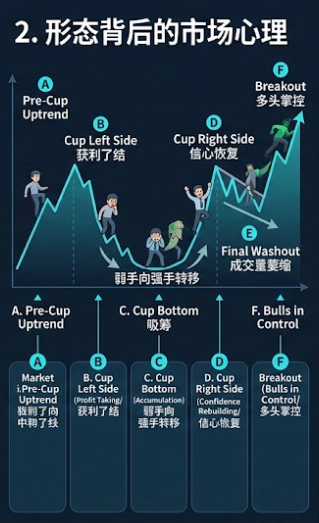
The pattern attracts attention because it reflects a recognizable progression in trader psychology during a broader uptrend:
Left side of the cup—profit-taking: After an advance, early buyers take profits. The resulting supply pushes price lower.
Cup bottom—accumulation: As selling pressure fades, value-oriented buyers gradually enter. Sentiment shifts from fear to cautious optimism and a rounded bottom forms. Ownership moves from weaker hands to stronger hands.
Right side of the cup—confidence returns: Price recovers steadily from the bottom. Confidence improves, and buyers who missed the earlier move enter as price approaches the previous high.
Handle—the final shakeout: Near the prior high, some traders take profits again, producing a modest pullback. Volume usually contracts noticeably during the handle, suggesting that selling pressure is limited and much of the available supply has already been absorbed.
Breakout—buyers take control: Once most sellers have been cleared, bullish conviction strengthens. Price breaks above handle resistance on rising volume and attracts a new wave of buying.
This progression is why traders use the Cup and Handle as a potential continuation signal.
How to Identify the Pattern Accurately
Look for the following characteristics on a crypto chart:
Prior uptrend: The Cup and Handle should follow an established advance. It is generally a continuation pattern, not a reversal pattern.
Cup shape: The cup should be a rounded U, not a sharp V. A smoother, more symmetrical cup that develops over a longer period is generally considered more reliable. Because crypto is volatile, the cup can be deeper than comparable stock-market formations.
Handle structure: After the cup's right side returns near the prior high, price pulls back modestly or consolidates. The ideal retracement is no more than one-third of the cup's depth; a deeper decline weakens the bullish setup. The handle should remain in the upper half of the cup, preferably the top third.
Volume behavior: The typical sequence is declining volume as the cup develops, low volume during the handle, and a noticeable expansion on the breakout. Higher breakout volume is an important confirmation signal.
Time frame: A cup often takes several weeks to several months to form, while the handle lasts several days to several weeks. Daily-chart formations tend to be more reliable. Four-hour and lower time frames contain more noise and can produce more false patterns.
Cup and Handle Trading Strategy
Entry
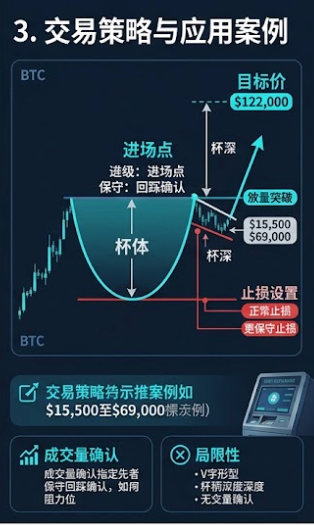
An aggressive approach enters as price breaks above handle resistance, provided that volume expands.
A conservative approach waits for price to retest the breakout level and confirm that former resistance has become support before entering.
Avoid entering before the pattern is complete, as an anticipated breakout can fail.
Price Target
A common method measures the cup's vertical depth from the rim to the bottom, then projects the same distance upward from the breakout point.
For example, Bitcoin declined from roughly $69,000 in 2022 to approximately $15,500, forming a potential cup. It later broke above a handle on stronger volume in September 2024. A cup depth of about $53,000 projected from the breakout level yields an illustrative target near $122,000. This example demonstrates the calculation; it does not guarantee that price will reach the projected level.
Stop-Loss Placement
A standard approach places the stop below the handle low, treating a break of that level as pattern invalidation.
A wider approach places the stop below the cup's midpoint. This can reduce the chance of being stopped by ordinary volatility, but it also increases the potential loss if the setup fails.
Volume Confirmation
The breakout should be supported by volume. If price clears handle resistance without a noticeable increase in volume, the move may lack staying power and can turn into a false breakout.
Limitations of the Cup and Handle
The Cup and Handle is a probability-based tool, not a guarantee. The setup can fail in several situations:
V-shaped bottom: A sharp V rather than a smooth U reflects a rapid sell-off and rebound, not orderly consolidation.
Handle is too deep: A retracement exceeding one-third of the cup's depth may indicate excessive selling pressure.
Handle lasts too long: An extended handle can evolve into a more complex structure.
Insufficient breakout volume: A breakout without clear volume expansion may be false.
Combine the pattern with support and resistance, moving averages, RSI, volume profile, broader market context, and multiple-time-frame analysis. No single indicator removes the need for risk management.
Frequently Asked Questions (FAQ)
Q1: Is the Cup and Handle a reversal or continuation signal?
It is generally a bullish continuation signal and should appear after an established uptrend. A similar shape in a downtrend should not automatically be interpreted as a standard Cup and Handle.
Q2: What is the success rate of the Cup and Handle?
Some estimates place its success rate near 80% when strict conditions are met and the structure is clear. Actual results depend on volume confirmation, time frame, market conditions, and risk management. Historical statistics do not guarantee future performance.
Q3: Which time frames work best?
Daily charts are generally more reliable because they filter more short-term noise. Four-hour and one-hour charts are more vulnerable to temporary volatility. Weekly and monthly formations develop slowly and are better suited to longer-term trend analysis.
Q4: What are common variations?
Variations include a wavy cup with several small swings at the bottom, a double-bottom handle, and a handle shaped like a descending wedge. The essential logic remains a rounded consolidation, a final pause, and a breakout. Reviewing historical Bitcoin and Ethereum charts can help train pattern recognition.
Related tutorials:
- Technical Analysis for Crypto Beginners: From Candlesticks to a Trading System
- Support and Resistance: How to Find Key Price Zones
- Volume Analysis: Reading the Relationship Between Price and Volume
- Classic Chart Patterns: Head and Shoulders, Double Tops, Triangles, and More
- How to Read Candlestick Charts: A Beginner's First Lesson
- Moving Averages Explained: Using MA and EMA to Identify Trends
- RSI Explained: A Practical Guide to Overbought and Oversold Signals
Recommended reading:
Lectura recomendada
Ver más