Crypto Market Cycle Analysis: From Bull-Bear Transitions to Sector Rotation
The crypto market moves in cycles of roughly four years, and each cycle runs the full course from Bitcoin dominance, through capital spillover and sector rotation, to a broad retreat. The key divide in today's market is this: after Bitcoin completed its "institutionalization" upgrade, its price action decoupled sharply from altcoins, and the old rule of "BTC → ETH → altcoins" came under real pressure in 2025. Understanding what a cycle really is, and the internal logic of sector rotation, is what keeps you clear-headed in the middle of this structural shift.
What a Cycle Really Is: From "Four-Year Halving" to "Macro Liquidity"
The halving mechanism is what gives the crypto market its roughly four-year cycle, because it imposes a hard constraint on supply: Bitcoin's issuance is cut in half every four years, and less new supply should in theory support the price. Historically, the cycle peaks after the 2016 and 2020 halvings both arrived about a year and a half later. But the halving only improves the supply side; it cannot create demand on its own. Fidelity's data shows the market cap to realized cap multiple approached 4 in the 2017 and 2021 cycles, while in the 2024-2025 cycle it mostly sat around 2 to 3, pointing to diminishing returns.
As spot Bitcoin ETFs launched and institutional participation deepened, the cycle's driving force began shifting from the "halving narrative" to the macro liquidity cycle. From 2021 to 2025, crypto went through a rare "three-market resonance" with US and Chinese equities: abundant global liquidity in Q4 2021 fueled an asset bubble, the Fed's fastest hiking cycle on record in 2022-2023 triggered a violent washout, and from 2023 to 2025 peak inflation, the rise of AI and rate-cut expectations drove a divided recovery. Bitcoin's 30-day correlation with the Nasdaq 100 has held steady at 0.75-0.85 for a long stretch, and pricing power in crypto is shifting from crypto natives to Wall Street fund managers.
Key Signals of a Bull-Bear Transition: How to Tell If a Trend Has Really Started
"The earliest stage of a mid-bull run" deserves a testable definition rather than a single big green candle. Here are the core indicators to watch:
Price completes a "breakout - retest - hold" sequence: a genuine trend confirmation requires a weekly close out of a long consolidation range, a retest on shrinking volume and exhausted selling pressure, and then a fresh expansion in volume. If price breaks out and quickly falls back into the old range, it is usually a liquidity trap or a short squeeze rather than a new trend.
Spot demand is stronger than derivatives: if a rally is driven mainly by rising perpetual futures open interest while spot volume lags, the market becomes fragile, and even a small pullback can trigger a chain of long liquidations. Watch whether spot trading, ETF creations and on-chain capital inflows are all improving together.
Short-term holders turn from loss to profit, but are not yet euphoric: when price moves above their cost basis and SOPR returns above 1, recent buyers have stopped selling at a loss on a broad scale. When MVRV hits historical extremes and nearly every coin is in profit, that looks far more like distribution than an early trend.
Stablecoin supply keeps expanding: sustained growth in the 30-day net issuance of stablecoins is the signal that new money is genuinely entering the market.
The Mechanics Behind Sector Rotation: A Stepwise Cascade of Capital Spillover
Sector rotation in crypto follows a clear path: Bitcoin (the base asset) → Ethereum (the leading public chain) → top altcoins (L2, DeFi, oracles and so on) → high-risk sectors (Meme coins, small caps).
The logic behind this transmission is the "capital spillover effect." Large off-exchange capital usually buys BTC first to lock in safety and liquidity. Once BTC has posted solid gains and holders are sitting on fat profits, some capital starts to spill over in search of better value. Ethereum and the leading public chains are the second stop, since they have large market caps and broad recognition. Capital then spreads further into "mainstream altcoin" sectors such as L2 and DeFi. Only at the very end, when sentiment turns frenzied, does money rush into Meme coins and small-cap projects to complete the final leg.
Historically, a healthy mid-bull expansion starts with BTC establishing credibility and then hands the baton to ETH and higher-risk assets. If the first thing to explode is only low-liquidity small caps, that looks more like localized speculation than the formation of a real trend.
The 2025-2026 Structural Shift: "BTC Sets the Stage, Altcoins No Longer Perform"
In 2025 the crypto market presented an unprecedented "split": driven by institutional money, BTC briefly touched $125,000, while most altcoins were down 80-95% from their 2021 highs and still failed to recover even as BTC hit new records. That pattern has shaken the classic "four-year cycle" narrative.
How Institutionalization Rewrote the Rules of the Game
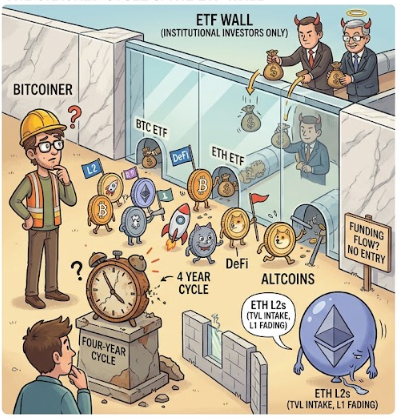
The launch of spot BTC ETFs was the key watershed. Traditional asset management giants such as BlackRock and Fidelity opened the door for BTC to become a "compliant asset," but their clients - pension funds, family offices and the like - only want BTC and will not touch altcoins. BTC has an SEC-approved spot ETF, CME futures and 15 years of brand building, while altcoins remain "unidentified assets" in institutional eyes that cannot pass traditional finance due diligence.
Structural lock-in of capital flows: of the tens of billions of dollars that flowed into BTC ETFs in 2025, more than 95% stayed locked inside the BTC ecosystem, with less than 5% reaching ETH and altcoins through OTC trades or DeFi bridges. The "capital spillover effect" of past bull markets has been blocked by this "ETF wall."
The Altcoin Season Index stayed below 20 for the entire year (above 50 marks an altcoin season), the longest slump on record.
Why Did ETH Fall Behind?
Ethereum's weakness is not only a matter of institutions staying away; it also stems from contradictions inside its own ecosystem. Layer 2 networks such as Arbitrum, Optimism and Base have seen their TVL approach 60% of the mainnet's, yet their tokens deliver little value capture for ETH and instead divert users and capital, because users on L2s pay in L2 tokens or stablecoins rather than ETH. Meanwhile, after moving to PoS, ETH yields roughly 3-4% annualized from staking, which cannot compete with 4.5% on US Treasuries, downgrading it from "programmable money" to an unappealing "interest-bearing bond."
Monitoring Methods and a Practical Framework for Sector Rotation
Core Indicators to Monitor
Seven-day net exchange inflows are an important tool for tracking capital movement. Cross-check them against BTC and ETH ETF flows, spot volume, BTC market cap share, the relative strength of ETH/BTC and SOL/BTC, funding rates and open interest.
BTC dominance: when dominance falls from above 50% to 40% or lower, capital is usually leaving BTC for altcoins.
Moves in a sector's leading coin: if the leader of a sector (for example ONDO in the RWA sector) suddenly jumps 20% on heavy volume, money is likely to sweep up the followers in the same sector next. When three or more of the top ten gainers suddenly belong to the same track, that sector is being attacked by concentrated capital.
A Practical Strategy Framework
"Hold the core, hunt the edges" capital allocation: keep 50% of the portfolio in BTC and ETH as a long-term base, split the remaining 50% in two - one part positioned early in promising sectors (such as RWA or DePIN, which have not yet rallied much), the other used to chase sectors that have already turned strong. Do not chase the high when you enter; wait for the sector leader to retest its 5-day or 10-day moving average.
Strategies by investor type: conservative investors should allocate more to Bitcoin, Ethereum and stablecoins; aggressive traders can add exposure to high-growth sectors in strong markets, keeping each position at 5-10% of the portfolio and spreading capital across 8-12 carefully selected projects.
Beware the "drain effect" at the end of a rotation: when Meme coins or small caps go vertical, Bitcoin and major coins tend to move sideways or even fall, because capital is being sucked away. That is a major warning sign that the broader market may be nearing a local top.

Frequently Asked Questions (FAQ)
Q1: Is the four-year cycle already over?
Not over, but its structure has been reshaped. The supply shock from halving is still there, yet demand is now driven by institutional allocation and macro liquidity rather than retail FOMO. The sharp divergence between BTC and altcoins in 2025 shows the old "BTC → ETH → altcoins" playbook may no longer work, and a "structural bull market" is now more likely than a broad-based one.
Q2: How can you tell if altcoin season has really begun?
Beyond the Altcoin Season Index, watch the relative strength of the ETH/BTC and SOL/BTC pairs. If Ethereum and Solana fail to strengthen against Bitcoin, even an index reading above 75 may be short-lived speculation rather than sustainable rotation. Also watch whether BTC dominance is genuinely rolling over.
Q3: Which sectors are worth watching during a rotation?
In 2026 the market is focused on two main threads: alternating rallies in "AI + DePIN" and the linked move in "Ethereum L2 + restaking." RWA (real-world assets) and AI agent tracks are also seen as potential destinations for capital.
Related tutorials:
On-Chain Data Basics: Exchange Inflows and Outflows, MVRV, NUPL
Fear and Greed Index: A Quantitative Guide to Market Sentiment
Recommended reading:
Lectura recomendada
Ver más