On-Chain Data for Beginners: Exchange Inflows and Outflows, MVRV, and NUPL
On-chain data is transparent information recorded directly on the blockchain ledger. It reveals where funds are moving, what the average cost of market participants is, and whether the market as a whole is in profit or loss. Unlike candlestick charts, which reflect the surface of price, on-chain data tracks real transfers on the chain. Many traders treat it as an important reference for judging where the market sits in its cycle and for spotting the moves of "smart money" such as institutions and whales.
Exchange Inflows and Outflows: Tracking Potential Buying and Selling Pressure
Exchange Netflow measures the direction in which tokens move between personal wallets and exchanges, showing whether holders are preparing to sell or to hold for the long term. It is one of the most intuitive on-chain signals and helps you gauge the market's underlying buying and selling pressure.
Exchange Inflow: tokens move from personal wallets into exchanges. This usually means holders are preparing to sell, creating potential sell pressure, and is read as a bearish signal.
Exchange Outflow: tokens are withdrawn from exchanges to personal wallets. This usually means large holders (whales) are moving assets into cold wallets for long-term storage, reducing the supply available on the market, and is read as a bullish signal.
A real-world example: during a decline in June 2026, Bitcoin's price was falling while net BTC outflows from exchanges hit a new high, and the price rebounded strongly over the following two weeks. This suggests that a falling price on the surface may be no more than noise, and that deeper changes in on-chain data are what matter.
On a larger cycle view, exchange Bitcoin balances have declined continuously since their early-2022 peak of roughly 3.3 million BTC, falling to about 3 million BTC by May 2026. BTC keeps flowing from exchanges to long-term holders and institutional custody, and this structural trend provides some support for the price.

MVRV: Judging Market Valuation
MVRV (Market Value to Realized Value) compares the current market cap with the "realized cap" to assess whether the market as a whole is in profit or loss, making it an important gauge of how expensive or cheap the market is.
The Core Logic
Realized Cap: the total market value calculated at the price of each Bitcoin's most recent on-chain transfer, often seen as the market's "average cost basis."
MVRV = Market Value ÷ Realized Value
MVRV > 1: the market as a whole is in profit.
MVRV < 1: the market as a whole is in loss.

Practical Application
Cycle top signal: when MVRV is very high, unrealized gains across the market are large and overheating risk builds. An MVRV Z-Score reading above 6 has repeatedly marked cycle tops in the past.
Cycle bottom signal: when MVRV approaches or falls below 1, it has usually corresponded to a historic bottom zone.
Current data reference (August 2026): Bitcoin's MVRV Z-Score is around 0.24, already close to the "green zone" that has accompanied several bear market bottoms. Analysts also note, however, that long-term holders still hold substantial unrealized gains (LTH-MVRV around 1.29), so the market may still face further downside pressure.
NUPL: Capturing Market Sentiment and Turning Points
NUPL (Net Unrealized Profit/Loss) measures market-wide unrealized profit as a share of market cap, directly reflecting the paper profit or loss of all holders.
How It Is Calculated
NUPL = (Market Value − Realized Value) ÷ Market Value
The higher the NUPL, the larger the paper profits across the market. A negative value means the market as a whole is in loss.
Market Sentiment Zones
Different NUPL values correspond to different stages of market sentiment:
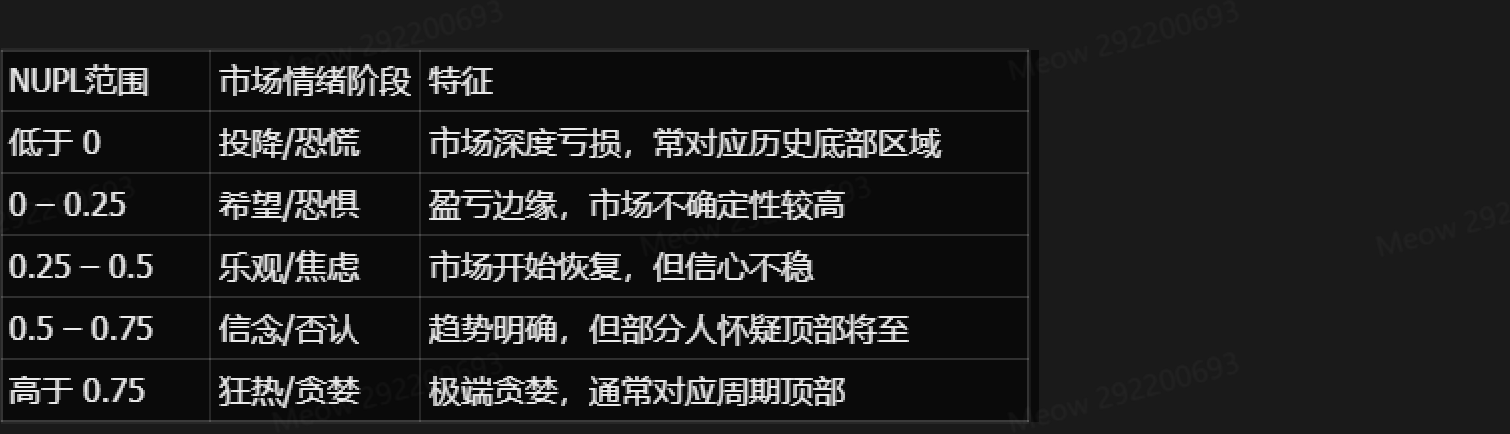
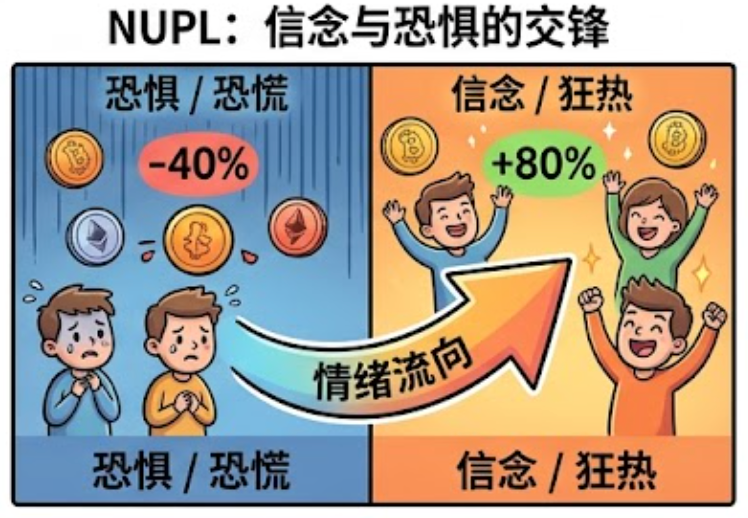
Practical Application: Historical Bottom Signals
Academic research shows that strategies based on the NUPL metric have significantly outperformed a buy-and-hold benchmark on a risk-adjusted basis.
Analysts more often watch the 100-day exponential moving average (EMA) of NUPL. Historically, when the NUPL 100-day EMA has dropped below the zero line, it has almost always coincided with a Bitcoin cycle bottom, such as 2015 (around $182), 2018 (around $3,200), and 2022 (around $15,800).
The current situation (August 2026): Bitcoin's NUPL is around 0.158 and the NUPL 100-day EMA is around 0.215, still above the zero line. That means if history repeats, the market may not have finished its final bottoming process, though this cycle may also form a "higher bottom" in which the floor is set while NUPL stays above zero.
Using NUPL and MVRV Together
These two metrics are often combined to judge where the market stands. Developers on TradingView, for example, have built composite indicators that calculate Z-Scores for MVRV, NUPL, and SOPR separately, weight them together, and produce a "bull and bear indicator" for identifying market phases.
A simplified framework:
When the MVRV Z-Score is near 0 and NUPL touches or drops below the zero line, the market is usually deeply undervalued, which can be an opportunity zone for long-term buying.
When the MVRV Z-Score is above 6 and NUPL enters euphoria territory above 0.75, the market may be overheating and a pullback risk is worth watching.
FAQ
Q1: Which on-chain metric should a beginner start with?
Start with exchange netflow and whale holdings, the two most intuitive metrics. They reflect the moves of large capital directly, are relatively easy to understand, and quickly build your feel for on-chain data.
Q2: What is the difference between MVRV and NUPL?
MVRV is the ratio of market value to cost basis, focused on judging valuation (expensive or cheap); NUPL is unrealized profit or loss as a share of market cap, focused on reflecting overall profit sentiment (greed or fear). The two are often used together: MVRV judges position, NUPL judges sentiment.
Q3: Can on-chain data be used directly for short-term trading?
On-chain data is better suited to judging medium- and long-term cycle position and trend than to short-term timing, because metrics such as MVRV and NUPL are typically daily or longer-horizon readings, while short-term trading depends more on candlestick prices and volume.
Q4: Where can I view this on-chain data?
Professional on-chain analytics platforms such as Glassnode and CryptoQuant offer the most comprehensive data, though mostly as paid services. TradingView also carries some free on-chain indicators based on public data, such as MVRV Z-Score and NUPL.
Related tutorials:
Crypto Market Cycle Analysis: From Bull-Bear Transitions to Sector Rotation
Bitcoin Halving Cycle Explained: The Wealth Code of a Four-Year Rhythm
Fear and Greed Index: A Quantitative Guide to Market Sentiment
Recommended reading:
Recommended
View more