
Dell (DELL) Stock Price | Live Chart, Market Cap and FAQs
DELL is the ticker for the common stock of Dell Technologies, Inc., listed on the New York Stock Exchange. The live chart and market cap on the page should come from the latest market data feed and change with trading activity; a snapshot at any one moment should not be treated as a permanent conclusion.
When reading this stock, first separate how much revenue comes from Infrastructure Solutions (servers, storage, etc.) and Client Solutions (PCs, etc.), then return to the quote page to understand the price and market cap.
Key Takeaways
- DELL is the ticker for Dell Technologies' common stock on the New York Stock Exchange; the company is headquartered in Round Rock, Texas, USA.
- The company primarily reports through the Infrastructure Solutions Group (ISG) and the Client Solutions Group (CSG); ISG includes AI-optimized servers, traditional servers and networking, and storage.
- The live chart reflects exchange trading during regular hours, 9:30–16:00 New York time; pre-market and after-hours prices are not official closing prices.
- Market cap is generally estimated as "share price × shares outstanding"; it is not cash on the company's books, nor does it mean all shares could be sold at the displayed price.
What Is Dell? Where Is DELL Listed?
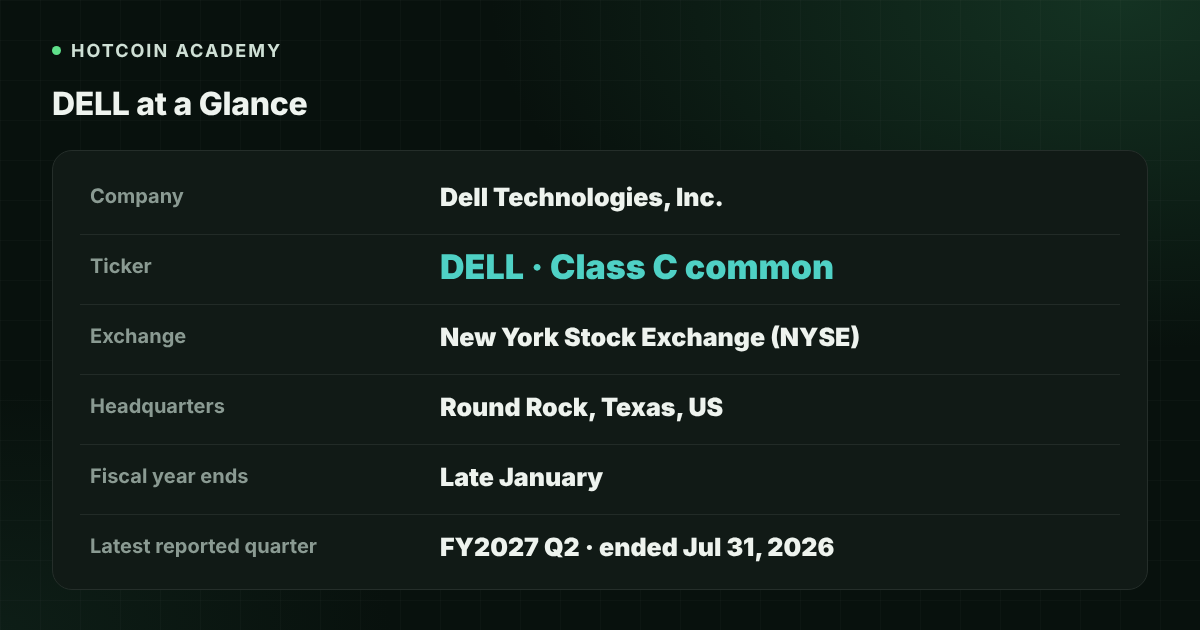
Dell Technologies is a company that provides IT products and services including servers, storage, networking and client computers; its current positioning emphasizes a technology and services portfolio for the AI era. The stock is listed on the New York Stock Exchange under the ticker DELL. The company's fiscal year usually ends in late January.
| Item | Details |
|---|---|
| Full company name | Dell Technologies, Inc. |
| Ticker | DELL (Class C common stock) |
| Exchange | New York Stock Exchange (NYSE) |
| Headquarters | Round Rock, Texas, USA |
| Fiscal year end | Usually late January |
| Latest reported quarter | FY2027 Q2, ended July 31, 2026 |
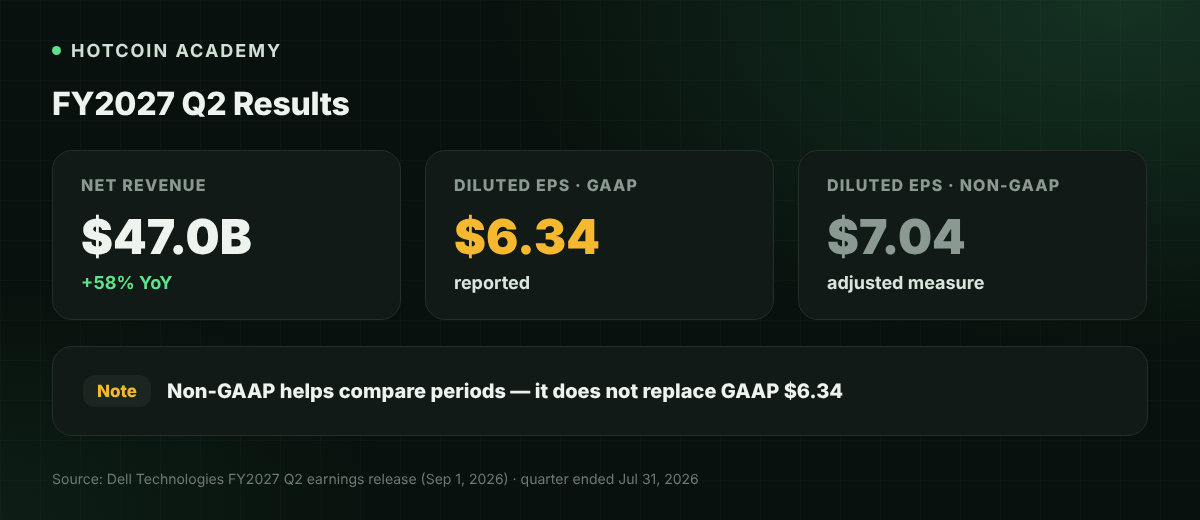
According to the FY2027 Q2 earnings release published on Dell Technologies' investor relations website on September 1, 2026, net revenue for the quarter was $47.0 billion, up 58% year over year, and diluted EPS was $6.34. These figures come from the company's published release and will be updated in later quarters; please refer to the latest filings.
What Businesses Drive Dell's Revenue Now?
Dell Technologies mainly divides its reportable segments into two groups:
| Segment | Net revenue for the quarter | YoY | Main components for the quarter |
|---|---|---|---|
| Infrastructure Solutions Group (ISG) | $31.8 billion | Up 89% | AI-optimized servers $16.4 billion; traditional servers and networking $10.5 billion; storage $4.9 billion |
| Client Solutions Group (CSG) | $15.0 billion | Up 20% | Commercial $13.2 billion; Consumer $1.8 billion |
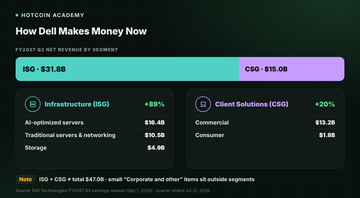
The combined net revenue of the two reportable segments differs from the company's consolidated net revenue by a small amount of unallocated items (called Corporate and other in the release's reconciliation), so the two columns in the table should not simply be added together and treated as total revenue.
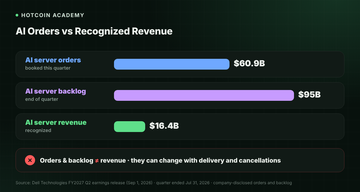
The same release also states that AI server orders for the quarter were $60.9 billion, and backlog at quarter-end was $95 billion. Orders can exceed revenue recognized in the quarter: net revenue for the quarter was $47.0 billion, of which AI-optimized servers contributed $16.4 billion in recognized revenue; the $60.9 billion is the value of orders booked during the period, not sales revenue already fully collected. These order and backlog figures are company-disclosed and will change with subsequent bookings, deliveries and cancellations; they are not equivalent to recognized revenue and certainly cannot be used to derive a "fair stock price."
When reading Dell's financial data, also distinguish between GAAP and non-GAAP measures. The release also gives non-GAAP diluted EPS of $7.04; such figures exclude items such as amortization of intangible assets and stock-based compensation, making cross-period comparison easier, but they do not replace the $6.34 reported under accounting standards.
How to Read DELL's Live Chart
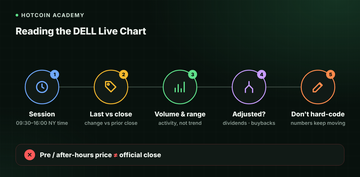
The live chart on the quote page comes from securities market trading. Here are suggested steps for reading it:
- Confirm the trading session first: Regular US market hours are 9:30 to 16:00 New York time. The corresponding Beijing time differs by 12 or 13 hours depending on daylight saving time; refer to the time zone noted on the page.
- Distinguish the latest price from the closing price: The latest price is the most recent trade price. The change is usually calculated relative to the previous trading day's official close. Pre-market and after-hours liquidity is often thinner, so those prices should not be treated as a confirmed closing result.
- Consider volume and the day's high and low: Intraday volatility may increase after server- and AI-related news, but high single-day volume does not mean a trend has been established.
- Watch dividends and buybacks: The company has cash dividend and share buyback programs, which may affect share count and chart displays; when comparing long-term trends, confirm whether the data is adjusted.
- Rely on the page's real-time data: This article does not hard-code the stock price, change or market cap at any particular moment.
How to Read Market Cap
Market cap is generally estimated as follows:
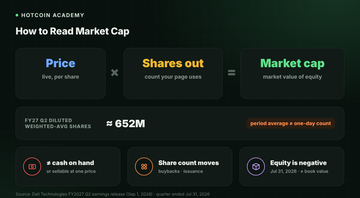
Market cap ≈ current share price × shares outstanding
The share count basis should follow the explanation on the quote page. Dell Technologies reported in its quarterly results that the diluted weighted-average shares used to calculate diluted EPS were approximately 652 million; this is the average for the period and does not equal the shares outstanding at the close on any given day. Buybacks reduce share count, while issuance or employee exercises increase it; calculations should use the figure adopted on the page at the time.
When reading market cap, remember: it is not cash on the company's books, nor does it equal the amount that would be received if all shares were sold at once at the displayed price. As of July 31, 2026, Dell Technologies' balance sheet showed negative stockholders' equity, related to factors such as cumulative buybacks; "large market cap" should not be understood as "equally large book net assets." This item changes in subsequent periods; please refer to the latest financial report.
Common Misconceptions
- "Dell only makes PCs": PCs belong to CSG; in recent revenue, ISG's servers, networking and storage account for a higher share, so read the latest segment data.
- "AI server orders equal revenue already booked": orders and backlog reflect demand that may be delivered later; revenue recognition still depends on actual delivery and accounting timing.
- "A high market cap means all shares can definitely be liquidated at that price": market cap is an estimate based on the latest trade price multiplied by share count; when market depth is limited, large sales may deviate significantly from the displayed price.
FAQs
Q1: On which exchange is DELL listed? DELL is the ticker for Dell Technologies, Inc.'s common stock on the New York Stock Exchange.
Q2: What are Dell's two main business segments now? It primarily reports through the Infrastructure Solutions Group (ISG) and the Client Solutions Group (CSG). In FY2027 Q2, ISG net revenue was $31.8 billion and CSG net revenue was $15.0 billion; refer to the company's latest release.
Q3: How is DELL's market cap calculated? Generally, current share price multiplied by shares outstanding. The weighted-average share count in financial reports is used for EPS and may not equal the share count used on the quote page at a given moment; refer to the page display.
Q4: Do pre-market or after-hours DELL prices count as the official closing price? No. The official closing price usually corresponds to the result at the end of regular trading hours; extended-hours prices are a separate session.
Q5: Can the stock price alone tell whether Dell is expensive? No. The stock price does not include information such as share count, profit margins, order quality and debt structure, and cannot alone serve as a basis for buying or selling.
Conclusion
DELL is the ticker for Dell Technologies' stock on the NYSE. When looking at this stock, first separate the revenue structure of ISG and CSG, distinguish company-disclosed orders and backlog from recognized revenue, then return to the quote page to read the live price and market cap; these figures change with the market and share count, and the page's real-time display and the company's latest releases should prevail.
If you also want to distinguish what "price" and "market cap" each explain and do not explain, you can start with What Are Market Cap, Circulating Supply and Fully Diluted Valuation (FDV)?.
Risk warning: This article is for educational and informational purposes only and does not constitute any investment advice or buy/sell recommendation. The financial figures cited come from the company's published financial reports or earnings releases and may be updated by later filings. US stock prices are highly volatile and may cause partial or total loss of principal. Please refer to the company's latest releases and the real-time data on your page, and make decisions carefully based on your own risk tolerance.
Recommended
View more