
AMD Stock Price | Live Chart, Market Cap & FAQ
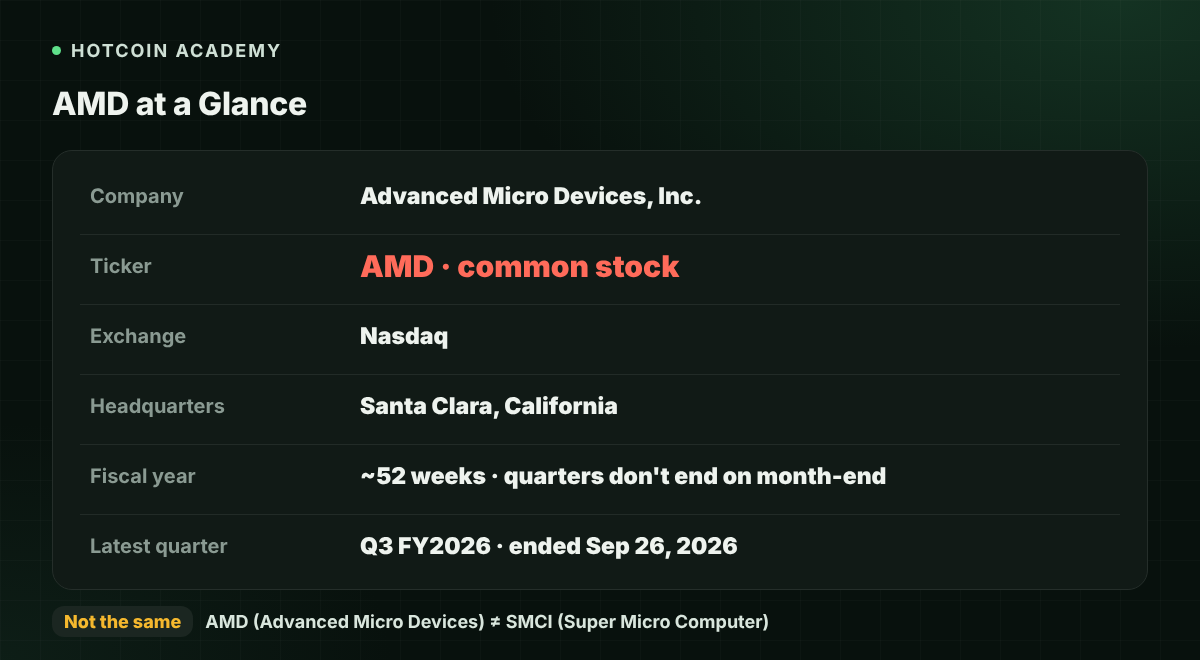
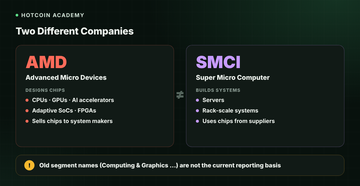
AMD (Advanced Micro Devices, Inc.) is the common stock ticker under which the company trades on Nasdaq. It is not the same company as Super Micro Computer (ticker SMCI): AMD designs and sells processors, accelerators and related chips, while Super Micro mainly provides servers and rack systems.
Key Takeaways
- AMD is the common stock ticker of Advanced Micro Devices, Inc. on Nasdaq; do not confuse it with Super Micro (SMCI).
- The company currently reports three segments: Data Center, Client and Gaming, and Embedded. Revenue for Client and Gaming is still disclosed separately within that segment.
- The live chart reflects exchange trades. Regular trading hours are 9:30–16:00 New York time; pre-market and after-hours prices are not the official closing price.
- Market cap is generally estimated as “share price × shares outstanding.” It is not cash on the company's books, and it does not mean all shares could be sold at the quoted price.
What Is AMD and Where Is It Listed?
Advanced Micro Devices, Inc. is headquartered in Santa Clara, California, and designs and sells processors, graphics processors, accelerators and adaptive chips for data centers, personal computers, gaming and embedded systems. Its stock trades on Nasdaq under the ticker AMD. The company uses a fiscal year of approximately 52 weeks, so quarter-end dates do not necessarily fall on calendar month-end.
| Item | Details |
|---|---|
| Company name | Advanced Micro Devices, Inc. |
| Ticker | AMD |
| Exchange | Nasdaq |
| Headquarters | Santa Clara, California |
| Reporting cycle | ~52-week fiscal year; quarter-end dates follow the company's accounting calendar |
| Latest reported quarter | Q3 FY2026, ended September 26, 2026 |
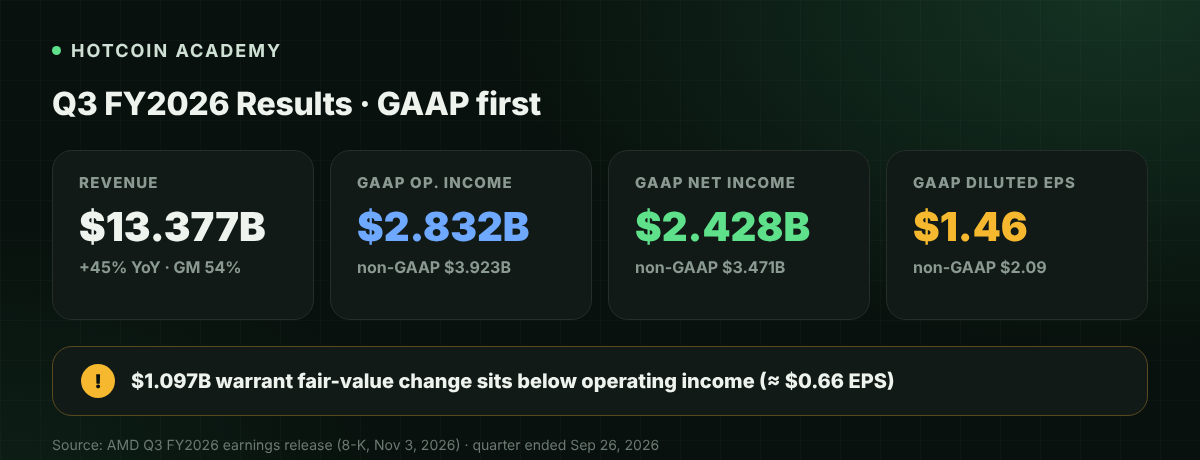
According to the Q3 FY2026 earnings release published on AMD's investor relations website on November 3, 2026, quarterly revenue was $13.377 billion, up 45% year over year; gross margin was 54%; operating income was $2.832 billion; net income was $2.428 billion, and diluted EPS was $1.46. The release also reported non-GAAP gross margin of 56%, non-GAAP operating income of $3.923 billion, non-GAAP net income of $3.471 billion and non-GAAP diluted EPS of $2.09. Non-GAAP figures exclude items such as stock-based compensation and amortization of acquisition-related intangibles; they help show operating trends but do not replace GAAP results. These figures come from the company's published release and will be updated in later quarters; please refer to the latest filings. The same release's non-GAAP reconciliation also shows a $1.097 billion fair-value change in warrant liabilities issued to certain customers during the quarter, with an impact of about $0.66 on diluted EPS. This change moves with the share price and other valuation assumptions, is not part of operating income for the three segments, and should be viewed separately when reading net income.
Which Segments Does AMD Report Today?
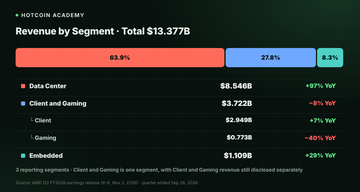
In this earnings release, the company states that it currently reports three operating segments. Note that Client and Gaming are no longer two separate reportable segments; they are combined into one “Client and Gaming” segment, while revenue for the two businesses is still disclosed separately.
| Segment | What it mainly includes | Q3 FY2026 revenue |
|---|---|---|
| Data Center | AI accelerators, server CPUs, GPUs, APUs, DPUs, AI NICs, FPGAs and adaptive SoCs for data centers | $8.546 billion, up 97% year over year |
| Client and Gaming | Desktop and notebook CPUs, APUs and chipsets, discrete GPUs, and semi-custom SoCs and related development services | $3.722 billion in total, down 8% year over year |
| Of which: Client | Mainly client processors for personal computers and similar devices | $2.949 billion, up 7% year over year |
| Of which: Gaming | Mainly discrete graphics and semi-custom products | $0.773 billion, down 40% year over year |
| Embedded | Embedded CPUs, APUs, FPGAs, system-on-modules (SOMs) and adaptive SoCs | $1.109 billion, up 29% year over year |
The same release also reports segment operating income: $2.882 billion for Data Center, $0.573 billion for Client and Gaming and $0.453 billion for Embedded, for a total of $3.908 billion across the three segments. Unallocated items are recorded under “All other” at -$1.076 billion for the quarter, mainly including amortization of acquisition-related intangibles, stock-based compensation and acquisition-related and other expenses; adding this item brings the total to GAAP operating income of $2.832 billion. The $1.097 billion fair-value change in warrant liabilities sits below operating income in other income/expense and is used to reconcile net income; it is not the difference between segment operating income and GAAP operating income, and the two figures should not be treated as the same item. The release also reports non-GAAP operating income of $3.923 billion; non-GAAP figures do not replace GAAP results. The company mainly attributes Data Center revenue growth to demand for AMD EPYC processors and Instinct series GPUs; Client growth mainly came from Ryzen mobile processors; the Gaming decline was related to lower semi-custom and graphics product revenue. These breakdowns help explain the revenue mix but cannot be directly converted into a “fair share price.”
If you see “Chaowei” and “Mei Chaowei” in a Chinese context, check the English names and tickers first: AMD is Advanced Micro Devices, and SMCI is Super Micro Computer. Both companies are involved in data center hardware, but their products and listed entities differ. When reading Chinese quotes or company profiles, note that some pages call AMD “美国超微公司AMD”; that still refers to Advanced Micro Devices, not Super Micro (SMCI). In addition, some profiles still describe the company under the old two-segment structure of “Computing and Graphics” and “Enterprise, Embedded and Semi-Custom”; that is no longer the basis used in the latest earnings release to report segment revenue. When discussing the current revenue structure, use the three reportable segments: Data Center, Client and Gaming, and Embedded.
How to Read AMD's Live Chart
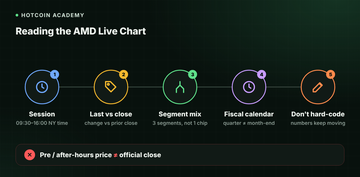
The “live chart” on a quote page generally comes from securities-market trade data. You can read it in these steps:
- Confirm the session first: U.S. regular trading hours are 9:30–16:00 New York time. The corresponding Beijing time differs by 12 or 13 hours depending on daylight saving time, so rely on the time zone stated on the page.
- Distinguish the latest price from the close: The latest price is the most recent trade and keeps moving during the session. Percentage changes are usually calculated against the previous trading day's official close. Pre-market and after-hours trading often has thinner liquidity and wider spreads, so it should not be treated as a settled closing result.
- Compare with the segment mix from the latest reported quarter: Look first at revenue changes in Data Center, Client and Gaming, and Embedded, then at price moves, so you do not explain the stock with a single product line.
- Mind the company's fiscal calendar: AMD's quarter-end dates are not necessarily the last day of March, June, September or December. Check the reporting period before comparing year-over-year or quarter-over-quarter figures.
- Do not hard-code a moment's numbers: Share prices change at any time. This section only explains how to read them; see the live figures on the page.
How to Read Market Cap
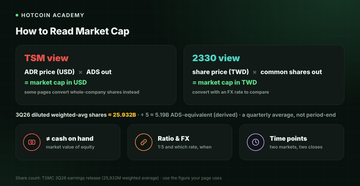
Market capitalization is generally estimated as follows:
Market cap ≈ current share price × shares outstanding
The share count depends on the basis used by the quote page. In Q3 FY2026, AMD used a weighted-average diluted share count of about 1.661 billion shares to calculate diluted EPS; that is a quarterly average and may not equal the exact shares outstanding at quarter-end. Buybacks, issuance or employee exercises will change the share count, so use the figure adopted by the page at the time.
There are three common boundaries when reading market cap:
- Market cap is not cash on the company's books, nor is it the amount you would receive if all shares were sold at once at the quoted price.
- A price move immediately changes market cap; buybacks or issuance change the share count, so market cap and share price do not necessarily move in the same proportion.
- Different websites may use different share-count dates, so calculated market caps may differ slightly; rely on the explanation on the page you are viewing.
Common Misconceptions
- “AMD is Super Micro, and the tickers are similar”: AMD (Advanced Micro Devices) and SMCI (Super Micro Computer) are two different listed companies; do not mix their financials or quotes.
- “It still reports four separate segments: Data Center, Client, Gaming and Embedded”: the current basis is three reportable segments, with Client and Gaming combined into one segment while their revenue is still disclosed separately. Refer to the company's latest filings.
- “Data Center has the highest revenue, so the stock must rise”: Data Center is currently the largest, but the share price is also affected by valuation, competition, export controls, inventory cycles and market risk appetite; the revenue mix alone is not a buy or sell basis.
FAQ
Q1: On which exchange is AMD listed? Is it the same company as Super Micro? No. AMD is the Nasdaq common stock ticker of Advanced Micro Devices, Inc. Super Micro refers to Super Micro Computer, ticker SMCI; the two should not be confused.
Q2: Which business segments does AMD have now? According to the Q3 FY2026 earnings release, the company reports under three operating segments: Data Center, Client and Gaming, and Embedded. Client and Gaming are not two separate reportable segments, but the company still discloses their revenue separately. Products include EPYC, Instinct, Ryzen and embedded and adaptive chips; refer to the latest filings.
Q3: How should I read AMD's latest quarterly results? In Q3 FY2026 (ended September 26, 2026), GAAP revenue was $13.377 billion, operating income was $2.832 billion, net income was $2.428 billion, and diluted EPS was $1.46. Data Center revenue was $8.546 billion. Non-GAAP figures are supplemental and do not replace GAAP results; refer to the latest release for later quarters.
Q4: How is AMD's market cap calculated? Generally, current share price multiplied by shares outstanding. The share count changes with buybacks, issuance and employee exercises, and the market cap on the page is calculated by the system using data at that time; rely on the quote page.
Q5: Do pre-market or after-hours moves count as the official close? No. Pre-market and after-hours trading are extended sessions with usually thinner volume, and their price moves are not the same as the official closing price.
Conclusion
AMD is the Nasdaq ticker of Advanced Micro Devices, Inc.; do not treat it as the same company as Super Micro (SMCI). To follow the stock, first confirm the current three reportable segments and the revenue mix of the latest reported quarter, then return to the quote page to read the live price, percentage change and market cap. These figures change with the market; rely on the live page and the company's latest releases.
To better distinguish what “price” and “market cap” each do and do not tell you, you can start with What Are Market Cap, Circulating Supply and Fully Diluted Valuation (FDV)?.
Risk warning: This article is for educational and informational purposes only and does not constitute investment advice or a recommendation to buy or sell. The financial figures come from the company's published financial statements or earnings releases and may be updated by later filings. U.S. stock prices are volatile, and semiconductor and AI-related companies may also be affected by competition, supply chains, export controls and cyclical swings, which may cause partial or total loss of principal. Please rely on the company's latest releases and the live data on your page, and make decisions carefully according to your own risk tolerance.
Recommended
View more