
Costco (COST) Stock Price | Live Chart, Market Cap & FAQ
COST is the ticker for Costco Wholesale Corporation's common stock listed on Nasdaq. In Chinese, the company is commonly called "Hao Shi Duo" (Hao Shi Duo) in Taiwan and other regions, while its official stores in mainland China use the name "Kai Shi Ke" (Kai Shi Ke). Some quote pages also refer to the company as "Kai Shi Ke." The ticker COST refers to the same publicly listed company. The live chart and market cap on the page should be powered by the latest market data and will change with trading activity; do not treat a snapshot at any moment as a permanent conclusion.
When reading this stock, first separate net merchandise sales from membership fee revenue, and check whether comparable sales have excluded the impact of gasoline prices and foreign exchange rates, then return to the quote page to understand price and market cap.
Key Takeaways
- COST is the Nasdaq ticker for Costco's common stock. The company operates membership-based warehouse clubs and also runs e-commerce sites.
- Revenue mainly comes from net merchandise sales and membership fees. When looking at growth, besides net sales, also compare the company-disclosed comparable sales and their adjusted basis.
- The live chart reflects exchange trading. Regular trading hours are 9:30–16:00 New York time; pre-market and after-hours prices are not the official closing price.
- Market cap is generally estimated as "share price × shares outstanding." It is not the company's cash or inventory, nor does it mean all shares could be sold at the displayed price.
What Is Costco? Where Is COST Listed?
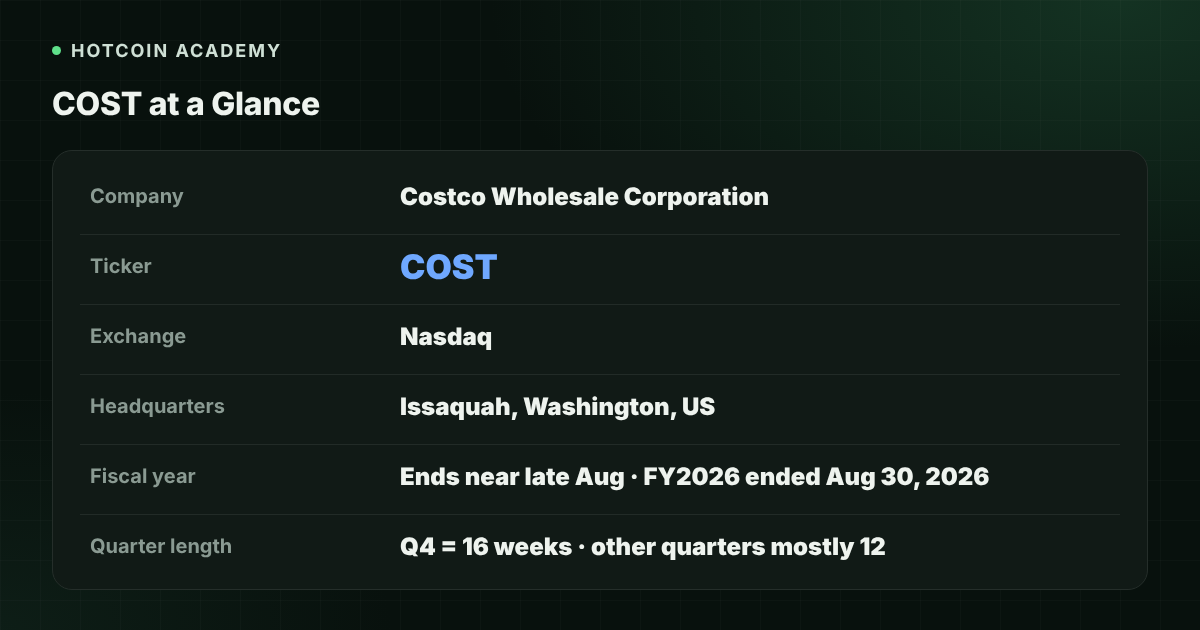
Costco Wholesale Corporation is headquartered in Issaquah, Washington, USA. It sells food, household goods, and other merchandise through membership-based warehouse clubs and charges membership fees. Its stock is listed on Nasdaq under the ticker COST. The company's fiscal year typically ends near the end of August. The fourth quarter has 16 weeks, while other quarters mostly have 12 weeks, so it is not appropriate to directly compare the fourth quarter's absolute sales with other quarters.
| Item | Details |
|---|---|
| Company name | Costco Wholesale Corporation |
| Ticker | COST |
| Exchange | Nasdaq |
| Headquarters | Issaquah, Washington, USA |
| Fiscal year end | Typically near the end of August; FY2026 ended August 30, 2026 |
| Latest reported period | Q4 FY2026 (16 weeks) and full-year FY2026 (52 weeks) |
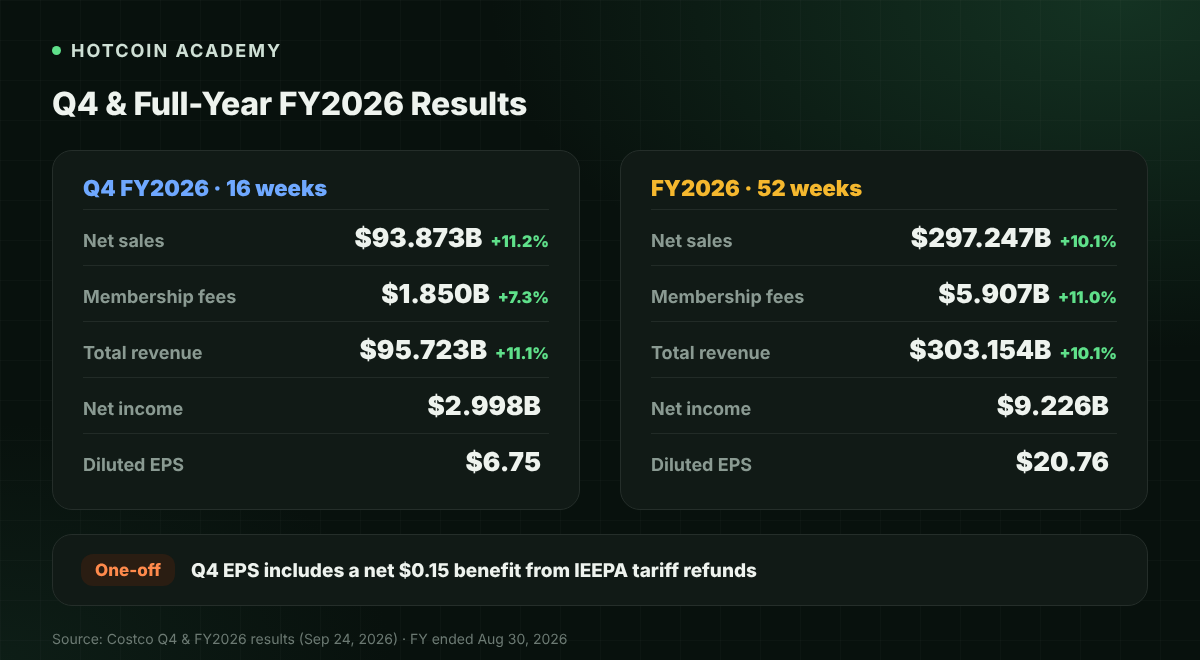
According to Costco's Q4 and fiscal year 2026 operating results announcement published on the investor relations website on September 24, 2026, net sales for the quarter were $93.873 billion, up 11.2% year over year; membership fee revenue was $1.850 billion; total revenue was $95.723 billion; net income was $2.998 billion, and diluted EPS was $6.75. For full-year fiscal 2026, net sales were $297.247 billion, up 10.1% year over year; membership fee revenue was $5.907 billion; total revenue was $303.154 billion; net income was $9.226 billion, and diluted EPS was $20.76. These figures come from the company's published announcement. At the time of the announcement, Q1 FY2027 had not yet been reported; subsequent quarters will be updated, so please refer to the latest filings.
In the same announcement, the company stated that diluted EPS for the quarter included a non-recurring item: a net benefit of $0.15 per share from IEEPA tariff refunds, after deducting the portion of refunds used to increase member value. When reading EPS, this item should be distinguished from recurring operating results.
How to Read Costco's Revenue and Store Count?
Costco's revenue can be split into merchandise sales and membership fees:
| Item | Q4 FY2026 (16 weeks) | YoY | Full-Year FY2026 (52 weeks) | YoY |
|---|---|---|---|---|
| Net sales | $93.873 billion | +11.2% | $297.247 billion | +10.1% |
| Membership fees | $1.850 billion | +7.3% | $5.907 billion | +11.0% |
| Total revenue | $95.723 billion | +11.1% | $303.154 billion | +10.1% |
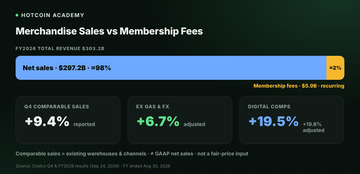
When looking at growth, the company also discloses comparable sales. For the quarter, company-wide comparable sales grew 9.4%, or 6.7% excluding the impact of gasoline prices and foreign exchange rates; digital comparable sales grew 19.5%, or 19.8% on an adjusted basis. Comparable sales are used to observe sales changes at existing stores and channels; they do not replace GAAP-reported net sales and cannot be used to directly derive a "fair stock price."
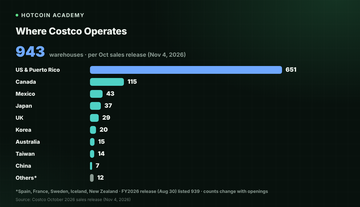
The following store count comes from the October sales announcement released on November 4, 2026, which is later than the 939 stores listed at the time of the full-year FY2026 results announcement (fiscal year ended August 30). According to Costco's October sales announcement published on the investor relations website on November 4, 2026, the company operated 943 warehouses at that time, including 651 in the US and Puerto Rico, 115 in Canada, 43 in Mexico, 37 in Japan, 29 in the UK, 20 in Korea, 15 in Australia, 14 in Taiwan, 7 in China, and the remainder in Spain, France, Sweden, Iceland, and New Zealand. It also operates e-commerce sites in the US, Canada, UK, Mexico, Korea, Taiwan, Japan, Australia, and China. Store counts may change with subsequent openings or adjustments; please refer to the company's latest disclosures. Some third-party profiles may still show earlier total store counts and should not be directly adopted.
How to Read COST's Live Chart?
The live chart on the quote page comes from securities market trading. It is recommended to read it in the following steps:
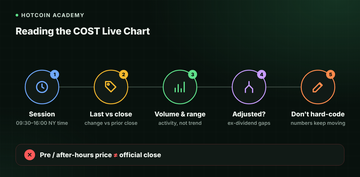
- Confirm the trading session first: Regular US stock trading hours are 9:30 to 16:00 New York time. The corresponding Beijing time differs by 12 or 13 hours depending on daylight saving time; refer to the time zone indicated on the page.
- Distinguish the latest price from the closing price: The latest price is the most recent trade price. Percentage change is usually calculated relative to the previous trading day's official closing price. Pre-market and after-hours liquidity is often thin, so do not treat it as a confirmed closing result.
- Consider volume and the day's high/low: Intraday volatility may increase after earnings, membership fee adjustments, or consumer data releases, but high single-day volume does not mean a trend has been established.
- Watch for the impact of dividends on charts: The company has a cash dividend policy. Unadjusted prices may show gaps on ex-dividend dates; when comparing long-term trends, confirm whether the page is adjusted.
- Rely on the page's real-time data: This article does not hard-code the stock price, percentage change, or market cap at any specific moment.
How to Read Market Cap?
Market cap is generally estimated as follows:
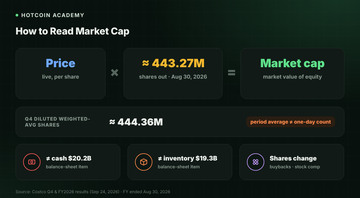
Market cap ≈ Current share price × Shares outstanding
The share count basis is subject to the explanation on the quote page. As of August 30, 2026, Costco's balance sheet listed approximately 443.266 million common shares outstanding; the weighted-average diluted shares used to calculate diluted EPS for the quarter were approximately 444.364 million. The latter is the period average and is not equal to the shares outstanding at the close on any given day. Buybacks or employee equity arrangements will change the share count; calculations should use the figure adopted by the page at that time.
When reading market cap, remember: it is not the company's cash on the books, nor does it equal inventory or deferred membership fees, and it is not the amount that would be received from selling all shares at once at the displayed price. As of August 30, 2026, the company reported cash and cash equivalents of $20.207 billion and merchandise inventory of $19.324 billion; these are balance sheet items and cannot be directly equated with market cap.
Common Misconceptions
- "Costco only makes money by selling goods": Net merchandise sales are the largest component, but membership fees are a recurring revenue source and should be viewed separately.
- "Comparable sales and net sales are the same thing": Comparable sales usually target existing stores and may exclude the impact of gasoline prices and foreign exchange rates; they are not equivalent to net sales, which include factors such as new stores.
- "More cash on the books means the market cap is necessarily safer": Cash, inventory, and equity market cap are different concepts. Market cap changes immediately with the share price and does not guarantee that all shares can be liquidated at the displayed price.
FAQ
Q1: On which exchange is COST listed? COST is the ticker for Costco Wholesale Corporation's common stock listed on Nasdaq. In Chinese, it is often called "Hao Shi Duo," while official stores in mainland China use "Kai Shi Ke"; both refer to the same company.
Q2: Where does Costco's revenue mainly come from? Mainly from net merchandise sales and membership fees. In Q4 FY2026, net sales were $93.873 billion and membership fees were $1.850 billion; for full-year FY2026, net sales were $297.247 billion and membership fees were $5.907 billion. Please refer to the company's latest announcement.
Q3: How is COST's market cap calculated? Generally, current share price multiplied by shares outstanding. The weighted-average share count in financial reports is used to calculate EPS and may not equal the share count adopted on the quote page at a given moment; please refer to the page display.
Q4: Do pre-market or after-hours COST prices count as the official closing price? No. The official closing price usually corresponds to the result at the end of regular trading hours; extended-hours prices are separate trades.
Q5: Can the share price alone tell whether Costco is expensive? No. The share price does not include information such as share count, membership fees, comparable sales, and profit margins, and cannot alone constitute a basis for buying or selling.
Conclusion
COST is the Nasdaq ticker for Costco. When looking at this stock, first separate net sales from membership fees, and check whether comparable sales have excluded the impact of gasoline prices and foreign exchange rates, then return to the quote page to read the live price and market cap. These figures will change with the market and share count and should be based on the page's real-time display and the company's latest announcements.
If you also want to distinguish what "price" and "market cap" each explain and do not explain, you can first read What Are Market Cap, Circulating Supply, and Fully Diluted Valuation (FDV)?.
Risk warning: This article is for educational and informational purposes only and does not constitute any investment advice or buy/sell recommendation. The financial figures in this article come from the company's published financial reports or earnings announcements and may be updated by subsequent filings. US stock prices are highly volatile and may cause partial or total loss of principal. Please refer to the company's latest announcements and the real-time data on your page, and make prudent decisions based on your own risk tolerance.
Recommended
View more