What Is the Bitcoin Rainbow Chart? The Nine Color Bands Explained
The Bitcoin Rainbow Chart is one of the most widely circulated long-term price charts in crypto: a logarithmic regression curve wrapped in nine color bands, from deep blue "Fire Sale" at the bottom to dark red "Maximum Bubble Territory" at the top. It looks like a valuation model, but it behaves more like a sentiment thermometer with a regression line attached.
This article explains what the chart plots, how the nine bands are calculated, what the November 2026 position means, and why it works better as background context than as a buy or sell signal.
Key Takeaways
• The Rainbow Chart plots Bitcoin price on a logarithmic scale, using a long-term regression curve and nine color bands to show where price sits relative to trend.
• The nine bands run from "Fire Sale" at the bottom to "Maximum Bubble Territory" at the top, each roughly 0.2 orders of magnitude apart.
• In November 2026, Bitcoin was around $77,000, roughly 0.27 orders of magnitude below the ~$142,000 midline, placing it in "Still Cheap."
• The Rainbow Chart has no scientific basis and refits as new data arrives, so it is unsuitable as a timing tool; it is better for understanding cycle position.
What Is the Bitcoin Rainbow Chart?
The Bitcoin Rainbow Chart is maintained by Blockchain Center. It takes every daily closing price since Bitcoin began trading, fits a logarithmic regression curve, and draws color bands at fixed distances above and below the curve. The result is a rainbow arc that rises over time but flattens in slope.
The idea behind it is simple: Bitcoin's early price growth was multiplicative, while later growth is percentage-based. On a log scale, that growth looks more like a straight line than an exponential curve. The regression line represents the "long-term trend," and the color bands show how stretched or compressed price is relative to that trend.
It is not an on-chain metric, not a cash-flow model, and not an adoption-based valuation. It is just a curve fitted to historical prices. That makes it good at summarizing cycles and bad at predicting the next move.
The Nine Bands, From Bottom to Top
The Rainbow Chart's original labels were deliberately colloquial, describing market psychology rather than fundamentals.
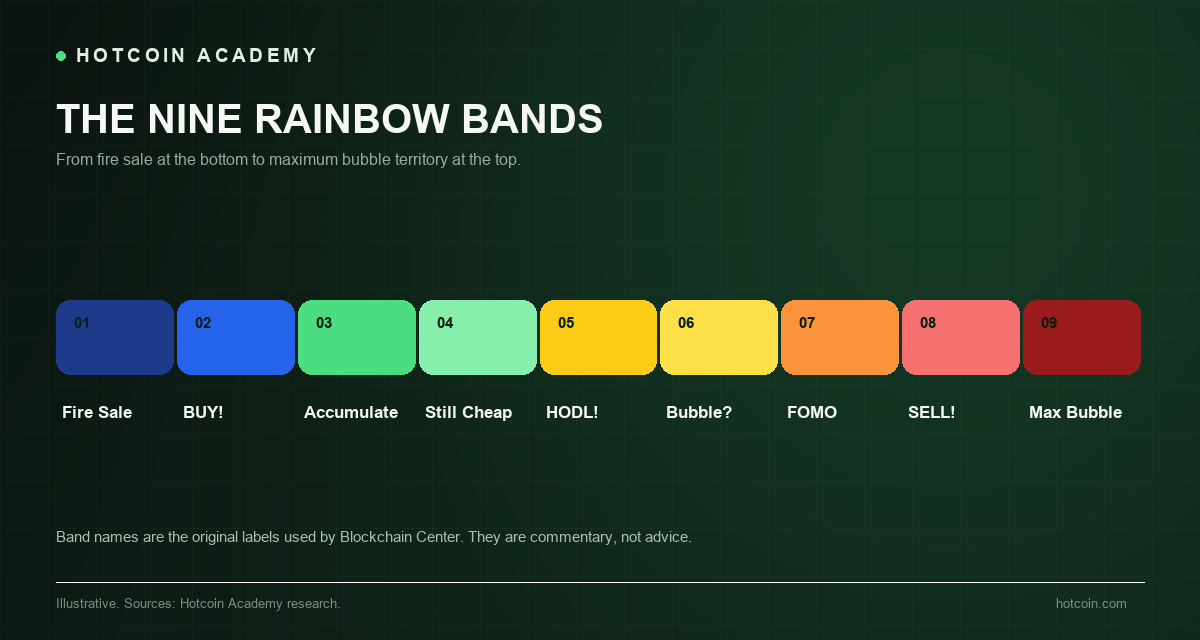
Chart: The nine Rainbow Chart bands, from Fire Sale to Maximum Bubble Territory.
| Band | Label | Description |
|---|---|---|
| 1 | Fire Sale | Far below trend; rare and brief in history. |
| 2 | BUY! | Below trend; the chart suggests accumulation. |
| 3 | Accumulate | Relatively cheap versus the fitted curve. |
| 4 | Still Cheap | Slightly below the midline. |
| 5 | HODL! | Near the midline; historically the most common zone. |
| 6 | Is this a bubble? | Slightly above the midline. |
| 7 | FOMO Intensifies | Above trend; momentum and leverage begin to build. |
| 8 | Sell. Seriously, SELL! | Far above trend; historically near cycle tops. |
| 9 | Maximum Bubble Territory | Extreme stretch; only a handful of days in history. |
Labels are the original names used by Blockchain Center; descriptions are adapted for this article.
Each band is roughly 0.2 orders of magnitude apart, meaning each band up is about 1.58x the price of the one below. Two bands above the midline is roughly 2.5x trend; three bands above is roughly 4x.
How Is the Curve Calculated?
The original formula came from a 2014 Bitcointalk post by user trolololo. It expressed the base-10 logarithm of price as a linear function of the natural logarithm (ln) of days since the genesis block: Price = 10^(2.9065 × ln(days) − 19.493). The Rainbow Chart was later popularized, and Blockchain Center has revised the model multiple times.
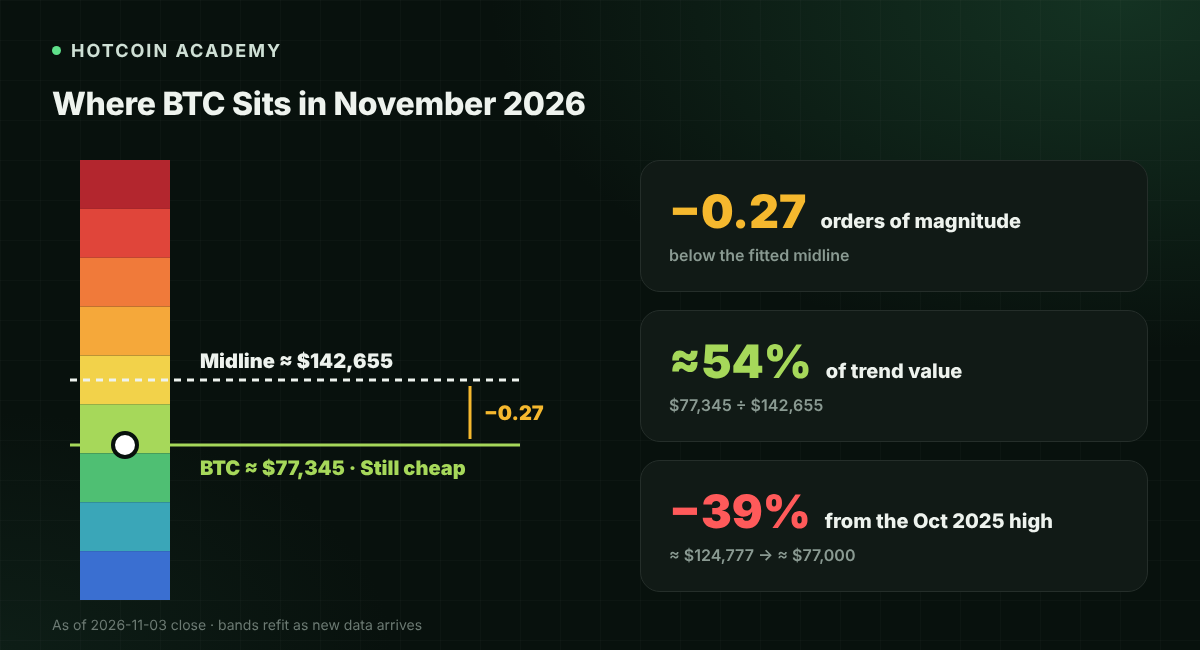
The current version is a dynamic Power Law regression fitted to all daily data since 2012. Blockchain Center reports an R² of about 94.3% and uses a 180-day window to mark cycle extremes. On November 3, 2026, the midline was around $142,655, and Bitcoin closed around $77,345, roughly 0.27 orders of magnitude below the midline.
Because the model refits with new data, the bands move. A price that looks "cheap" today may look "fair" two years from now, even if the price never changes. That is the most important thing to understand before using the Rainbow Chart: the scale is not fixed.
Where Bitcoin Sits in 2026
Bitcoin peaked on October 7, 2025, at around $124,777. By early November 2026, price was around $77,000, about 39% below the high. On the Rainbow Chart, that places it in the green "Still Cheap" band, clearly below the midline but still far from the bottom.
The Rainbow Chart's own history is a warning. About 75% of Bitcoin's trading days fall in the middle three bands; the top band has appeared only about 100 days out of 5,903 total, and the bottom band only 36 days. The outer colors look dramatic, but they are statistically very rare, and waiting for them can take years.
The 2026 cycle also exposed the model's limits. The 2025 top stalled in the middle bands and never touched the red zone; in June 2026, price briefly broke below the "Fire Sale" band during a broad crypto selloff. A model built to mark extremes gave both a false top and a false bottom.
Why Is It So Controversial?
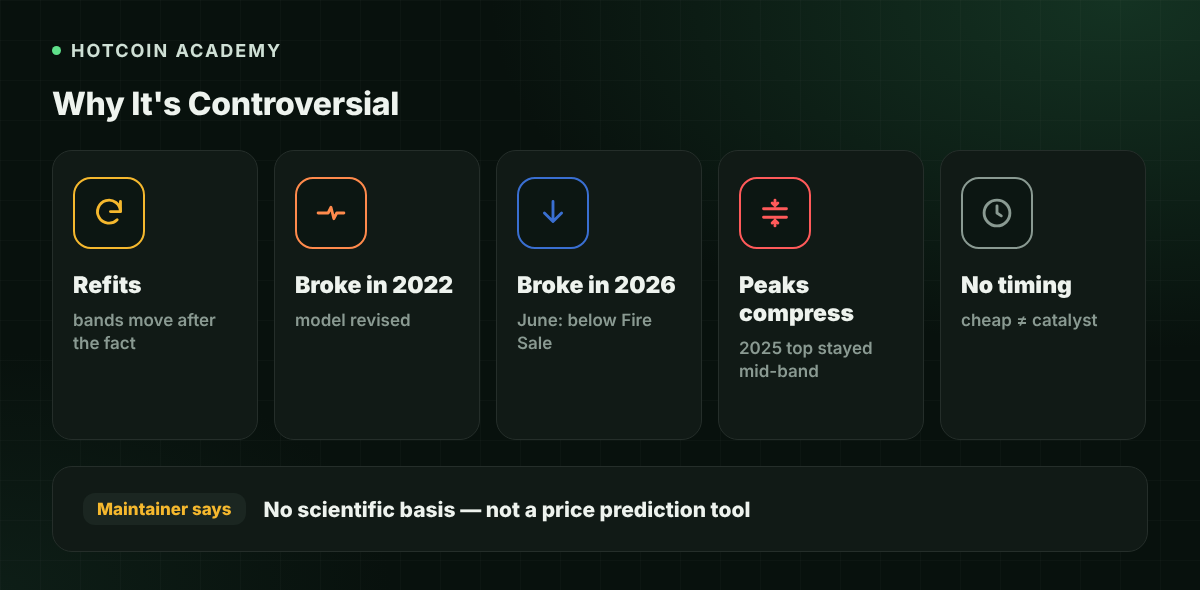
The chart's maintainers are candid: Blockchain Center states plainly that the Rainbow Chart has no scientific basis and should not be used to predict Bitcoin's price. That honesty is commendable, and it also explains how the chart should be used.
• It fits the past: the regression recalculates with new prices, and the bands change after the fact.
• It broke once in 2022: price fell below the old lower band, and the model was revised rather than declared invalid.
• It broke again in 2026: the June selloff pushed price below the "Fire Sale" band, showing that extremes can overshoot.
• Cycle peaks are compressing: the 2025 top stayed mid-band, suggesting the old band widths may no longer fit a more mature Bitcoin.
• It offers no timing: price can stay in the same band for months or years; "cheap" is not a catalyst.
This does not mean the Rainbow Chart is useless. It describes a long-term trend, not a trading system. The real mistake is treating the colors as signals.
How to Use It Without Getting Hurt
If you find the Rainbow Chart useful, treat it like a long-term moving average: as context for position sizing and risk, not as a trigger.
• Pair it with fundamentals: ETF flows, on-chain supply, stablecoin liquidity, real rates, and regulation matter more than color.
• Watch the midline, not the labels: the real information is the distance between price and trend; the band names are just packaging.
• Respect regime changes: a model fitted from 2012 to 2021 may not describe a 2026 market with spot ETFs and institutional custody.
• Leave room for being wrong: if you buy because the chart is green, know in advance what would change your mind.
Perhaps the most useful thing about the Rainbow Chart is psychological: it visualizes the distance between price and trend and forces you to ask whether the current move is fundamentals-driven or narrative-driven. That question is worth more than any color.
Reading the Chart Step by Step
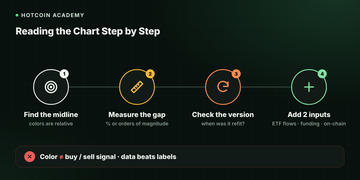
If you want to use the Rainbow Chart without treating it as a signal, read it in the same order every time.
• Find the midline first: the reference point is the fitted curve, not the color. Everything else is distance from it.
• Measure the gap: express price as a percentage of the midline or in orders of magnitude. A 30% gap and a 3x gap are very different risks.
• Check the version: ask when the model was last refit. A chart that rewrites its own history is a narrative tool, not a measuring tool.
• Add two independent inputs: ETF flows, realized volatility, funding rates, or on-chain supply. If they contradict the color, trust the data, not the label.
The final test is simple: if you cannot explain why price is above or below trend without pointing at the rainbow, then the chart is not giving you information—it is confirming your feelings.
Common Pitfalls
• Treating "Fire Sale" as a guaranteed bottom: price can break below the bands and stay there for a long time.
• Using the Rainbow Chart for short-term timing: it is fitted to more than a decade of daily closes.
• Ignoring model revisions: the scale is recalculated, and historical bands are not stable.
• Assuming it predicted past tops: Bitcoin's 2025 top never touched the red zone.
FAQ
Is the Bitcoin Rainbow Chart accurate? It gives an intuitive description of long-term trend but is not a forecasting tool. The model refits, breaks during major moves, and most trading days sit in the middle three bands. Treat it as context, not a prediction.
Where is Bitcoin on the Rainbow Chart right now? In early November 2026, Bitcoin was around $77,000, with the midline around $142,000, placing it in the "Still Cheap" band. Price and the fitted curve change daily, and so does the band.
Should I buy when price hits Fire Sale? No rule guarantees the bottom band is the bottom. In June 2026, price briefly broke below it. If you treat it as a signal, pair it with position control and a plan for further declines.
Why was the Rainbow Chart revised? The original 2014 formula became too optimistic as Bitcoin matured. After price broke below the old lower band in 2022, Blockchain Center revised the model and later introduced the dynamic Power Law version that continuously refits.
Does the halving affect the Rainbow Chart? Halving dates are marked on the chart as reference lines, but the regression model does not use issuance as a variable. The relationship between halvings and price is a historical pattern, not a mechanical rule.
Conclusion
The Bitcoin Rainbow Chart is a beautiful summary of long-term trend and a poor substitute for a trading plan. It tells you where price sits relative to a fitted curve; it does not tell you where price is going.
Use it to understand cycles, not to outsource decisions. If you want to track Bitcoin price and market data together, start with Hotcoin's BTC price page and research updates.
Risk disclaimer: This article is for educational and informational purposes only and does not constitute investment advice. Crypto assets are highly volatile, and investors may lose all principal. Past performance does not guarantee future results.
Recommended
View more