Bitcoin Rainbow Chart and the ahr999 Accumulation Indicator Explained
The rainbow chart and the ahr999 accumulation indicator are the two most widely used valuation tools for long-term Bitcoin investing. The first shows, through color bands, where the current price sits within its historical valuation range; the second turns that judgement into a precise number that tells you whether the market is cheap enough to buy or expensive enough to sell. The rainbow chart goes back to an idea posted on Reddit by user azop in 2014 and has been in use since the V2 upgrade in 2019; the ahr999 indicator was created by Weibo user "Jiushen" and is widely followed in the Chinese Bitcoin community.
The Bitcoin Rainbow Chart: Reading Valuation by Color
The rainbow chart fits Bitcoin's historical price with a logarithmic regression curve, then overlays rainbow-colored bands across different valuation zones to show the long-term trend. The closer the price is to the blue end, the closer it is to a bottom; the closer to red, the closer it is to a top.
What the color bands mean
The rainbow chart usually contains 9 bands, which from bottom to top are:
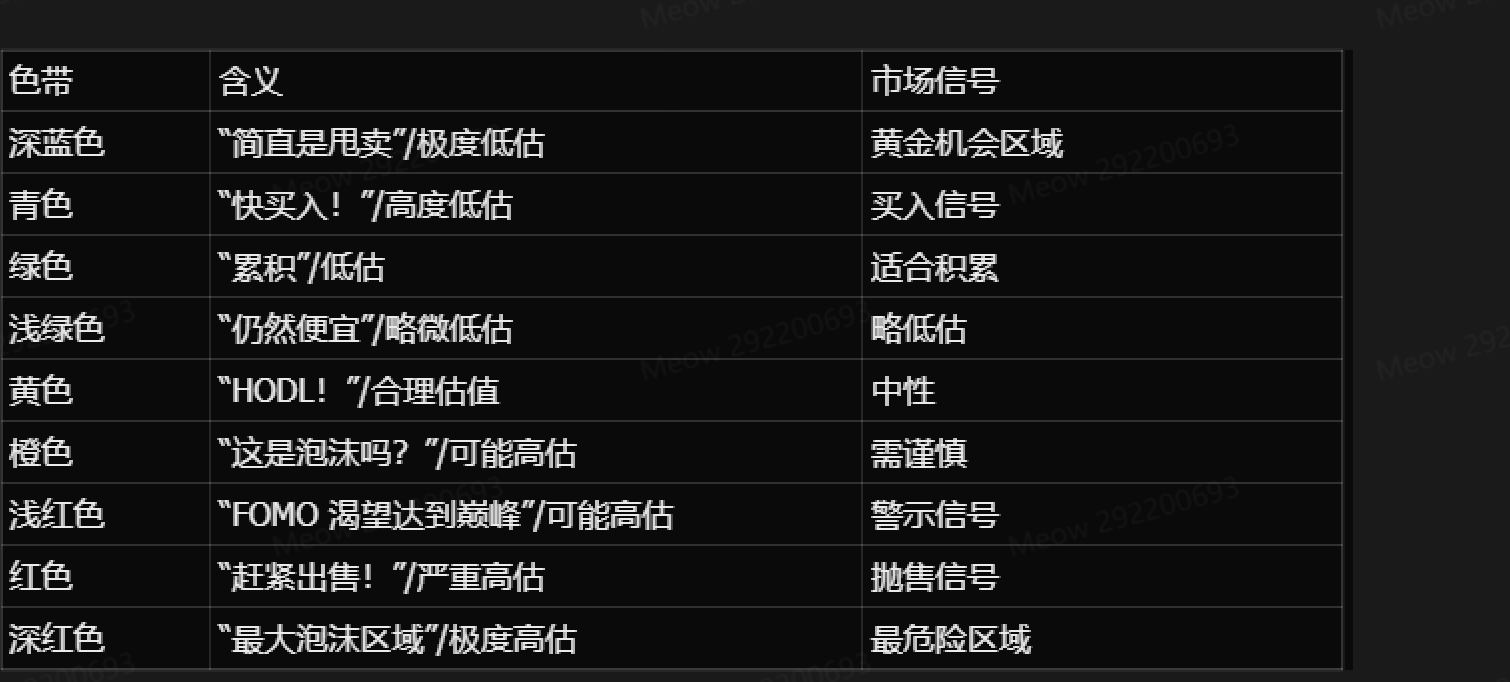
The chart uses a logarithmic scale. The blue zone at the bottom marks oversold conditions (a potential buying opportunity), while the red zone at the top marks overbought conditions (a potential sell signal).
How to use it effectively
In practice the rainbow chart works as a long-term trend gauge rather than a short-term trading signal. A suggested process:
Identify the current band: hover over the price line and see which band it sits in
Check the historical context: look at how price behaved the last time it was in the same band
Combine other tools: analyze it alongside RSI, MACD and volume indicators
Watch for its limits: it relies entirely on historical data and ignores regulation, black swan events and other external factors

Where things stand in 2026
As of August 2026, Bitcoin trades around USD 78,000-80,000, roughly 38% below its all-time high of USD 126,000. By the rainbow chart's logic, Bitcoin sits somewhere in the yellow-to-orange zone, the boundary between "fair value" and "slightly overvalued." That is broadly consistent with a Fear & Greed Index of about 74 (greed) over the same period, though it is still a long way from the historical "red bubble zone."
Some analysts note that as Bitcoin's market cap grows, the highest point of each cycle has become a less useful reference on the rainbow chart, while its ability to identify bottom zones during bear markets remains relatively accurate.
The ahr999 Accumulation Indicator: Quantifying DCA and Dip Buying
The ahr999 accumulation indicator multiplies Bitcoin's price against two benchmarks, the 200-day DCA cost and an exponential growth valuation, to judge with a single number whether the market is undervalued or overvalued.
Composition and formula
The core formula of the ahr999 indicator is:
ahr999 = (Bitcoin price ÷ 200-day DCA cost) × (Bitcoin price ÷ exponential growth valuation)
Where:
200-day DCA cost: the average daily price over the past 200 days, used to measure whether buying now beats regular investing
Exponential growth valuation: a trend line fitted on the positive correlation between Bitcoin's price and block height (coin age), representing the price an asset of this age "should" have reached
Multiplying the two ratios leaves Bitcoin's price squared in the numerator and the product of the DCA cost and the exponential growth valuation in the denominator. In theory, if either ratio is below 1, the current price is relatively undervalued; if both are below 1, price is deeply undervalued and it is a good time to buy the dip.
Operating zones
Based on historical backtests, the distribution of the ahr999 index and the recommended action for each zone is as follows:
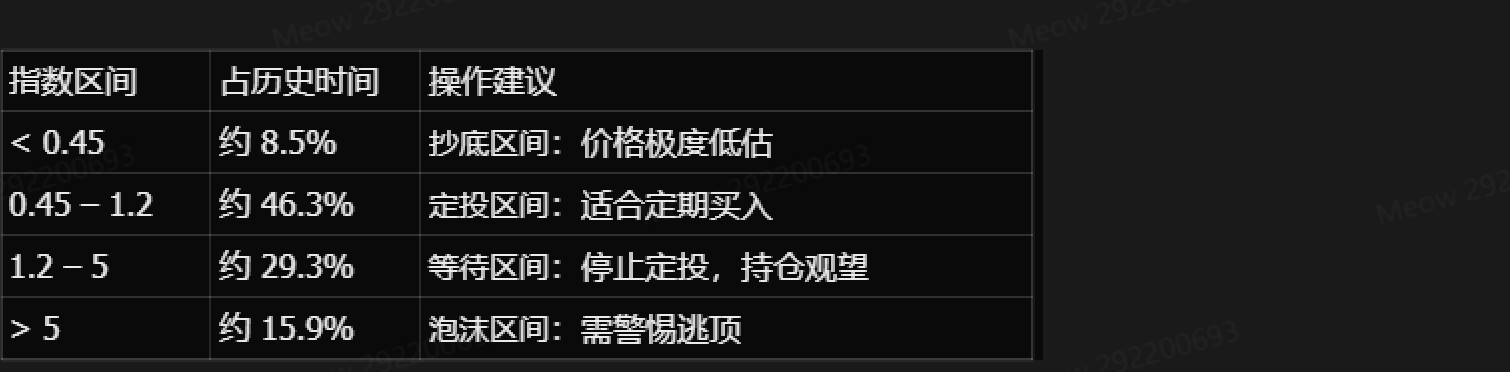
This means Bitcoin has spent less than 10% of its history in the "buy the dip" zone, close to half the time in the DCA zone, and the remainder in zones where further buying is not advisable.

A real-world test: the 2020-2022 cycle
Taking the 2020-2022 cycle as an example, the ahr999 indicator behaved as follows:
October 2020: the indicator broke above 1.2 (the DCA line) with BTC around USD 13,000, after which it entered a "stop DCA" phase
June 2022: the indicator fell below 0.45 (the dip-buying line) with BTC around USD 23,000
January 2023: the indicator recovered above 0.45 with BTC around USD 21,000
Across the whole cycle, after DCA stopped in October 2020, Bitcoin bottomed near USD 15,000-16,000 at the end of 2022. That was far below the USD 69,000 all-time high, yet still above the USD 13,000 of October 2020. The lesson: for investors who had already accumulated coins at lower levels, stopping DCA above 1.2 did avoid chasing the top, but for fresh capital, waiting until late 2022 to enter would likely have been better than continuing to DCA through the USD 40,000-50,000 range in 2022.
Limitations
The ahr999 indicator has two clear limitations:
Weak at calling tops: it is better suited to identifying bottoms and DCA timing, and its signal for bull-market tops is comparatively vague. As Bitcoin's market cap grows, the indicator's peak has fallen in each cycle, making the top zone hard to pin down
Parameters fitted to history: the exponential growth parameter in the formula was fitted to data from before 2018, so a new cycle may call for fresh backtesting and recalibration
Using Both Together: Building a Long-Term Buying Strategy
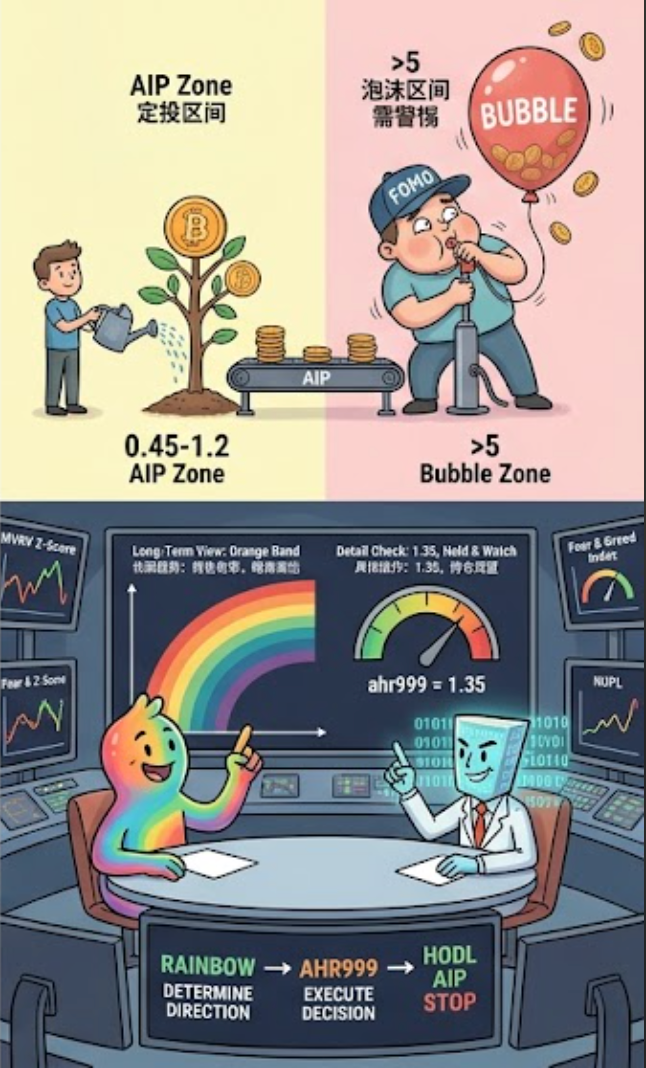
The rainbow chart and the ahr999 indicator work best as a pair, forming a complete "buy - DCA - wait - exit" framework:
The rainbow chart sets direction: use it to see quickly whether price is in the blue (undervalued), yellow (fair) or red (overvalued) zone, and settle the overall stance
The ahr999 indicator sets the detail: once the direction is clear, use the ahr999 index to pick the action - below 0.45 is "buy the dip," 0.45-1.2 is "DCA," and above 1.2 is "stop buying and hold"
Combine other tools for exits: both are weak at calling tops, so pair them with MVRV Z-Score, NUPL, the Fear & Greed Index and similar tools
FAQ
Q1: How are the rainbow chart's bands determined?
The rainbow chart fits Bitcoin's historical price with a logarithmic regression curve. It was created by Reddit user azop in 2014 as straight color strips, and in 2019 Rohmeo improved it into a curved shape (the V2 version) with a more rigorous mathematical formula.
Q2: How low does the ahr999 indicator have to go to count as "buying the dip"?
Below 0.45. Historical data shows the indicator sits below that level only about 8.5% of the time, usually when the market is extremely fearful and Bitcoin is deeply undervalued.
Q3: Are these two indicators suitable for short-term trading?
No. Both are long-term valuation tools that reflect trends on a monthly or even yearly scale, not buy and sell signals on a daily or hourly chart. Short-term trading should rely on candlesticks, RSI, MACD and other short-term technical indicators.
Q4: Where do the two indicators stand in August 2026?
A rough estimate: the ahr999 indicator entered the "waiting zone" above 1.2 in late 2025 when Bitcoin was around USD 90,000. With the 2026 pullback to the USD 78,000-80,000 range, it now sits around 1.2-1.5 (check CoinGlass for live values), close to the upper edge of the DCA zone but not yet back in the comfortable 0.45-1.2 DCA range.
Related tutorials:
Crypto Market Cycle Analysis: From Bull-Bear Transitions to Sector Rotation
Bitcoin Halving Cycles Explained: The Wealth Code of the Four-Year Rhythm
On-Chain Data for Beginners: Exchange Inflows and Outflows, MVRV, NUPL
The Fear & Greed Index: A Quantitative Guide to Market Sentiment
Recommended reading:
Recommended
View more