Ichimoku Cloud: The Wisdom of a Japanese Trading Master
Ichimoku Kinko Hyo is an all-in-one technical analysis system that combines trend direction, momentum strength, and projected support and resistance on a single chart, allowing traders to understand the market “at a glance.” Japanese journalist Goichi Hosoda created it in the 1930s and formally published it in the 1960s after decades of refinement. It remains one of the most comprehensive technical tools used across global financial markets. Its forward-looking features are especially valuable in the volatile, always-open cryptocurrency market because they map areas where support and resistance may develop, helping traders anticipate market behavior instead of merely reacting to it.
Five Major Components: See the Whole Market on One Chart
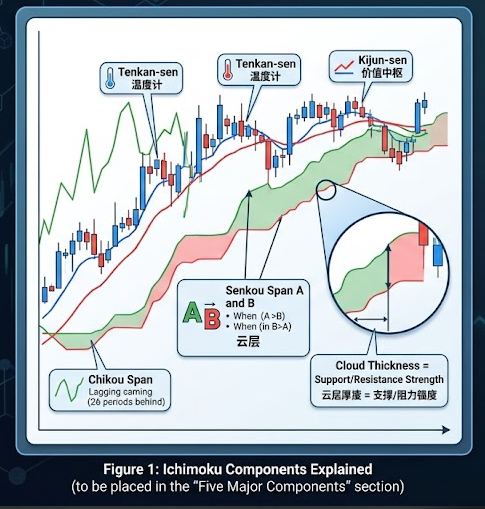
Ichimoku consists of five lines and a “cloud.” Understanding the role of each element is essential to using the system effectively.
Tenkan-sen (conversion line, blue): Calculated as (highest high + lowest low) / 2 over the previous 9 periods. It is the most responsive line and acts as a short-term momentum thermometer, often revealing the earliest signs of a trend change.
Kijun-sen (base line, red): Calculated as (highest high + lowest low) / 2 over the previous 26 periods. Its smoother movement represents the market’s medium-term value center. During strong trends, it often serves as dynamic support or resistance.
Senkou Span A (leading span A, green cloud boundary): The average of the Tenkan-sen and Kijun-sen, projected 26 periods into the future. It forms the faster cloud boundary.
Senkou Span B (leading span B, red cloud boundary): Calculated as (highest high + lowest low) / 2 over the previous 52 periods and also projected 26 periods forward. It forms the slower cloud boundary.
Kumo (cloud): The colored area between Senkou Span A and B and the system’s most recognizable visual element. When Span A is above Span B, the cloud is usually green or blue and indicates a bullish bias. When Span B is above Span A, the cloud is red and indicates a bearish bias.
Chikou Span (lagging span, green): The current closing price plotted 26 periods backward. It helps confirm trend strength. A Chikou Span above the price from 26 periods earlier supports a bullish reading; a position below that price supports a bearish reading.
A Three-Step Trading Process with Ichimoku
Once you understand the components, you can turn the framework into an actionable trading plan in three steps.
Step One: Identify the Trend by Reading the Cloud
The first task when opening a chart is to locate the price relative to the cloud:
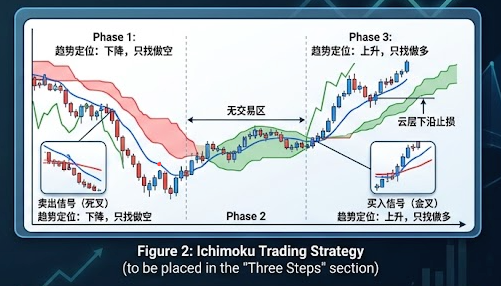
Price above the cloud: An uptrend; focus only on potential long setups.
Price below the cloud: A downtrend; focus only on potential short setups.
Price inside the cloud: A ranging or trendless environment. This is a “no-trade zone” where signals are mixed and entries should not be forced.
Cloud thickness also provides useful information. A thicker cloud represents stronger support or resistance and is harder for price to break. A thinner cloud is easier to penetrate and can indicate that a new move is about to begin.
Step Two: Confirm Signals with the Tenkan-Kijun Crossover
After determining the trend, use crossovers between the Tenkan and Kijun lines to look for specific entry opportunities:
Buy signal (bullish crossover): Tenkan crosses above Kijun while price is above the cloud and the Chikou Span is above price.
Sell signal (bearish crossover): Tenkan crosses below Kijun while price is below the cloud and the Chikou Span is below price.
Step Three: Execute the Trade and Manage Risk
After entry, the cloud itself offers a natural reference for stop placement. Traders often use the Kijun line as a trailing stop. A more conservative approach places the stop near the lower edge of the cloud. If price falls through the cloud, the broader bullish structure has likely been invalidated.
Practical Optimization for Crypto Markets
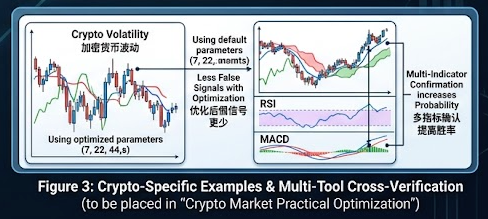
Cryptocurrency markets operate 24 hours a day, seven days a week, unlike the six-day trading week of the Japanese stock market in the 1930s. Some traders therefore adjust the default settings of 9, 26, and 52 to alternatives such as 7, 22, and 44 or 8, 22, and 44 to reflect crypto-market liquidity. Beginners should first learn how signals behave with the default settings, then consider optimization based on backtesting results.
Combining Ichimoku with Other Tools
Ichimoku is powerful, but it is not infallible. Cloud signals are generally clearer during strong trends and less reliable in sideways markets. RSI can help identify overbought or oversold conditions, while MACD can provide an additional momentum check and help filter false signals.
Frequently Asked Questions
How Is Ichimoku Different from a Standard Moving Average?
The calculations are different. Moving averages are generally based on closing prices, while the Tenkan and Kijun lines use the midpoint between the highest high and lowest low over each lookback period. More importantly, Senkou Span A and B are projected forward to form the cloud, providing a view of potential future support and resistance that ordinary moving averages do not offer.
What Does a Thicker Cloud Mean?
A thicker cloud can reflect higher market volatility and stronger future support or resistance. More momentum is required to break through a thick cloud, so a successful breakout may carry greater significance.
Which Time Frames Work Best with Ichimoku?
Signals are generally more reliable on the 4-hour and daily charts. Shorter periods such as 15-minute or 1-hour charts contain more noise and can generate more false signals.
Why Should Traders Avoid Trading While Price Is Inside the Cloud?
The cloud represents a balance between buyers and sellers. Inside this uncertain zone, Tenkan-Kijun crossovers can occur frequently and without direction, producing false breakouts and misleading signals. Waiting for price to move decisively beyond the cloud is generally more prudent.
Related Tutorials
Beginner’s Guide to Cryptocurrency Technical Analysis: From Candlesticks to a Trading System
Golden Cross and Death Cross: Practical Moving Average Crossover Signals
RSI Explained: A Practical Guide to Overbought and Oversold Signals
Recommended Reading
Recommended
View more