Trend Trading Strategy: A Profitable Method of Trading With the Trend
The core logic of trend trading is simple: once a trend forms, it is more likely to continue than to reverse. The trader's job is to identify the direction of the trend, enter on pullbacks, and exit before the trend ends. This runs against the instinct to buy low and sell high — in an uptrend, every pullback is a buying opportunity until the trend clearly turns. The crypto market shows pronounced price persistence, which gives trend-following strategies a statistical foundation.
Identify the Trend Before You Trade
The first step in trend trading is not finding an entry point but judging what state the market is in. Many traders lose money not because they read the direction wrong, but because they applied a trend strategy in a ranging market, or a range strategy in a trending market.
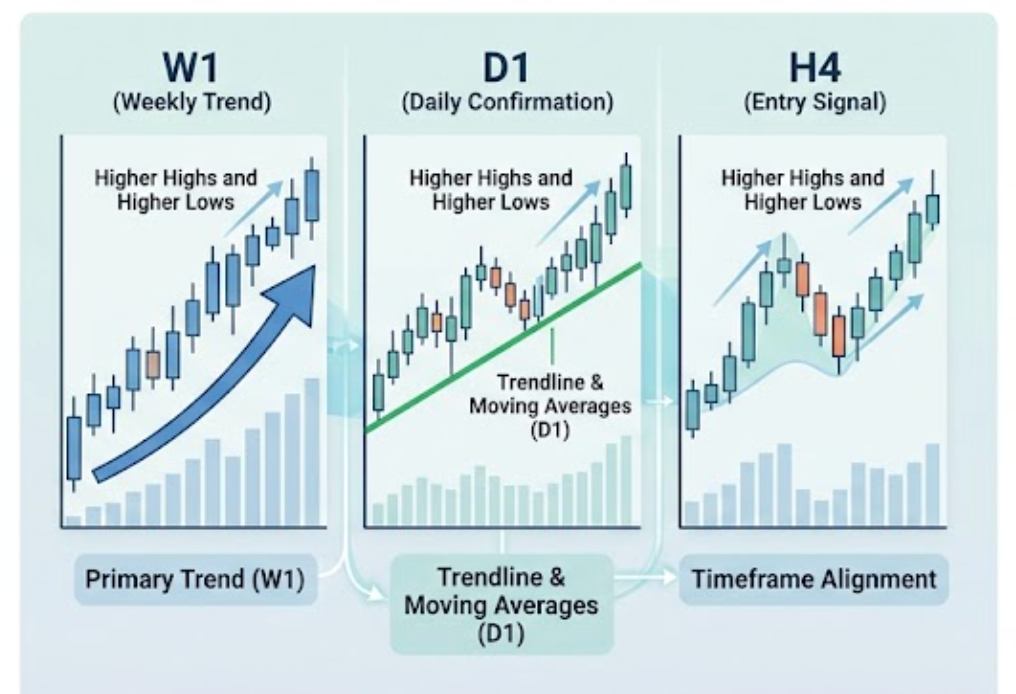
The definition of a trend: a classic uptrend is a sequence of higher highs and higher lows, while a downtrend is a sequence of lower highs and lower lows. That structure should be reasonably easy to identify on the timeframe you have chosen.
Trendlines are a simplified but effective tool: in an uptrend, connect the price lows into a rising support line; in a downtrend, connect the price highs into a falling resistance line. As long as price holds above the trendline, the trend is considered intact.
But a trendline is not a signal on its own. Professional traders confirm direction on a higher timeframe: first read the daily or even weekly chart to judge the primary trend, then drop to the 4-hour or 1-hour chart to look for entries. When the 4-hour, 1-hour, and 15-minute timeframes all point the same way, the reliability of the entry signal improves markedly — this is timeframe alignment.
How to Find Entries: Buy the Pullback, Follow the Breakout
Once a trend is confirmed, there are two main ways to enter:
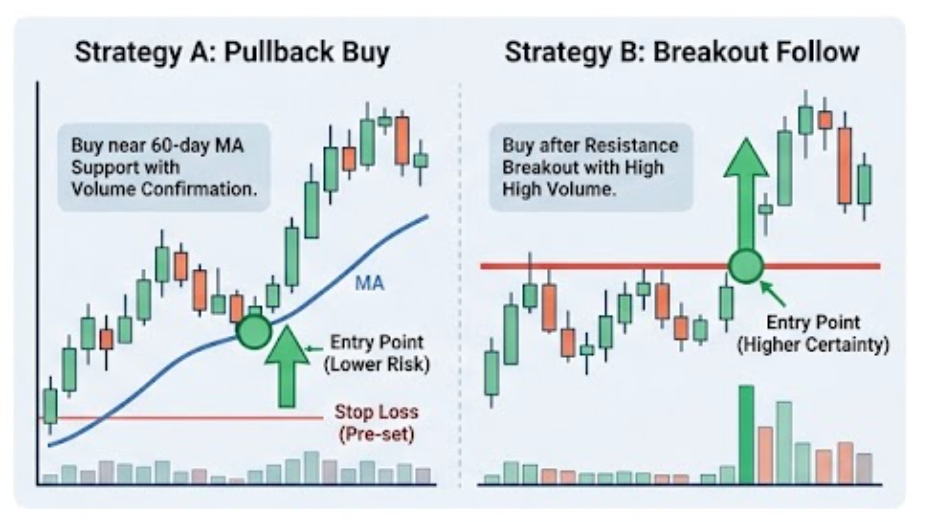
Pullback entry (the steadier option): in an uptrend, price never rises in a straight line and always pulls back along the way. The typical approach for trend traders is to buy when price pulls back to a key support level. Common support references include moving averages (such as the 50-day or 60-day MA), trendlines, and prior resistance that has turned into support.
Experienced traders stress that price holding steady at the 60-day moving average on a pullback, together with a sudden jump in volume, is the most reliable entry opportunity.
Breakout entry (the more aggressive option): follow price when it breaks a key resistance level on strong volume. The advantage is that the trend has already started and the setup is more certain; the disadvantage is a relatively poor entry price and a wider stop-loss distance.
Whichever entry you use, you must pre-set a stop loss before entering — usually below the trendline or below the previous low. This is the single most important part of a trading plan.
The Holy Grail of Trend Following: Let Profits Run
The point of a trend-following strategy is not to buy at the lowest price but to hold the position through the trend until there is clear evidence that the trend is over.
In practice, traders usually manage a trend in the following ways:
Dynamic stop loss (trailing stop): as price rises, keep moving the stop up to lock in profit already gained. A common approach is to place the stop below price at a key moving average or the previous low.
Scaling out: sell one third after a 30% gain, another third after a 50% gain, and trail the remainder with a moving stop. This locks in part of the profit while keeping the chance to stay in the trend.
A trend-following strategy needs relatively high volatility to work at its best — high-volatility markets usually come with sustained moves and active trading, while low-volatility markets offer fewer opportunities. This is also why trends in major coins such as BTC and ETH are easier to follow: their volatility and liquidity are far higher than those of small-cap coins.
Common Trend Trading Mistakes
Mistake 1: Sticking with a trend strategy in a ranging market. Trend following is not a universal answer. In 2025, with frequent false breakouts and rapid shifts in market logic, many trend-following funds suffered notable drawdowns, and the Barclay CTA Index performed poorly through the year. A trend strategy makes money in trending markets and gets stopped out repeatedly in ranging markets — that is the inherent cost of the strategy, not a system error.
Mistake 2: Going all in the moment a trend starts. Position sizing is the lifeline of trend trading. Even a correct trend can come with a 20%-30% pullback. An oversized position can be liquidated or forced to stop out during that pullback, losing the chance to take part in the rest of the trend.
Mistake 3: Mistaking a pullback for a reversal. In a clear uptrend, price pulling back to support and then rising again is normal continuation, not a signal that the trend is over. Many traders exit too early midway through a trend and miss most of the profit.
Mistake 4: Trading against the trend. Trying to short the top of an obvious uptrend, or to catch the bottom of an obvious downtrend, is the lowest-probability way to trade. The core idea of Adam Theory is that nobody can accurately predict when a trend will end, and blindly trading against it often leads to larger losses.
The Core Framework of a Trend Trading System
A complete trend trading system should include the following elements:
Trend judgment: use moving average alignment, trendlines, or a higher timeframe to determine the direction of the trend.
Entry rules: enter when price pulls back to a key support level (such as a moving average, trendline, or Fibonacci level) and a confirmation signal appears (such as a candlestick pattern or a surge in volume).
Stop-loss rules: pre-set a stop before entry, usually below the key support level. Exit as soon as price breaks that stop level.
Position management: hold the position while the trend continues, and manage profit with a trailing stop or by scaling out.
Exit rules: close the position when the trend structure breaks down (for example, price breaks below a rising trendline or moving averages form a death cross).
One experienced practitioner summed the framework up as: screen for strong names on the 11-day candle, catch the start of a new trend with a monthly golden cross, look for dip-buying opportunities at the 60-day moving average on the daily chart, and treat the 60-day moving average as the lifeline of the position.
Frequently Asked Questions (FAQ)
Q1: What is the difference between trend trading and dollar-cost averaging?
Trend trading enters actively once a trend is confirmed and exits actively when the trend ends, aiming to capture swing profit. Dollar-cost averaging is a long-term accumulation strategy that ignores timing and buys on a schedule, aiming to smooth out volatility over time. The time horizon and the operating logic are completely different.
Q2: What is the best timeframe for trend trading?
The daily and 4-hour charts are best for identifying valid trends. Shorter timeframes such as 15 minutes carry too much noise, while longer ones such as the weekly chart react too slowly — neither suits most individual traders.
Q3: What should trend traders do in a ranging market?
A trend strategy gets stopped out frequently in a ranging market; that is the inherent cost of the strategy, not a system error. A mature trend trading system does not force trades in a range. Instead it uses a market-state filter (such as the ADX) to tell whether the market is trending or ranging, and in a range it trades less or switches to a strategy suited to ranging conditions, such as grid trading.
Q4: How do you tell a real trend from a false breakout?
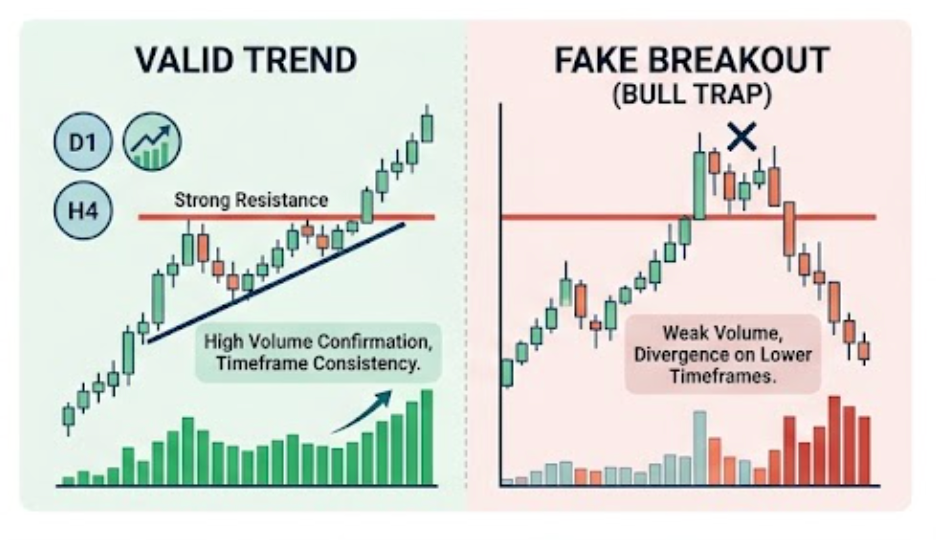
Confirm on several dimensions. First, volume — real breakouts usually come with a clear surge in volume. Second, timeframe alignment — a signal is more reliable when charts across multiple timeframes point the same way. Third, trendline persistence — a real trend finds support repeatedly at key levels rather than reversing right after a single breakout.
Related tutorials:
Recommended reading:
Recommended
View more