Microsoft (MSFT) Stock Price | Live Chart, Market Cap & FAQs
MSFT is the ticker for Microsoft Corporation's common stock listed on Nasdaq. The live chart and market cap shown on the page are fed by the latest market data and change continuously with trading activity, so a number captured at one moment should not be treated as a permanent conclusion.
To read this stock, separate two things first: what Microsoft currently earns money from, and what the price, change, and market cap on the quote page each represent.
Key Takeaways
- MSFT is the ticker for Microsoft's common stock listed on Nasdaq, not a shorthand for another company with the same name or a token.
- Starting with fiscal year 2027, Microsoft reorganized its reportable segments into two groups: Agents and Infra, and Devices and Consumer. Always refer to the company's latest earnings release.
- The live chart reflects exchange trading, with regular hours from 9:30 to 16:00 New York time; pre-market and after-hours prices tend to have thinner liquidity and do not equal the official closing price.
- Market cap is generally estimated as "share price × shares outstanding." It is not the cash on the company's books, nor does it mean all shares could be sold at the displayed price.
What Is Microsoft? Where Is MSFT Listed?
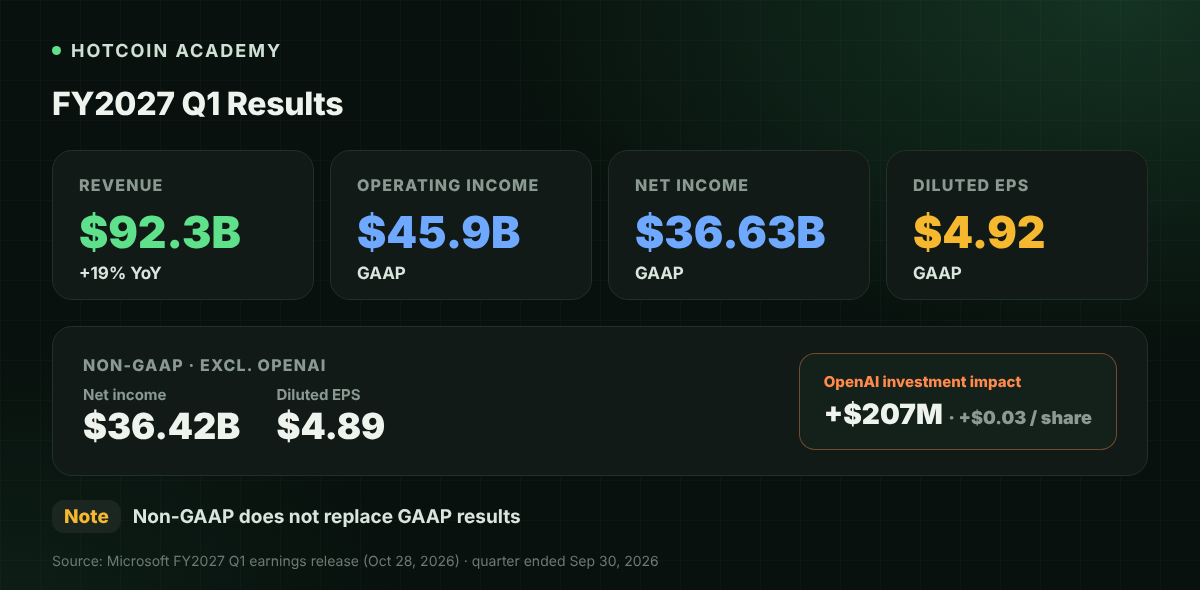
Microsoft is a technology company headquartered in Redmond, Washington, USA. Its business spans cloud computing, office software, AI platforms, search advertising, gaming, and Windows devices. Its stock trades on Nasdaq under the ticker MSFT, and its fiscal year ends on June 30.
| Item | Details |
|---|---|
| Company name | Microsoft Corporation |
| Ticker | MSFT |
| Exchange | Nasdaq |
| Headquarters | Redmond, Washington, USA |
| Fiscal year end | June 30 |
| Latest reported quarter | FY2027 Q1, ended September 30, 2026 |
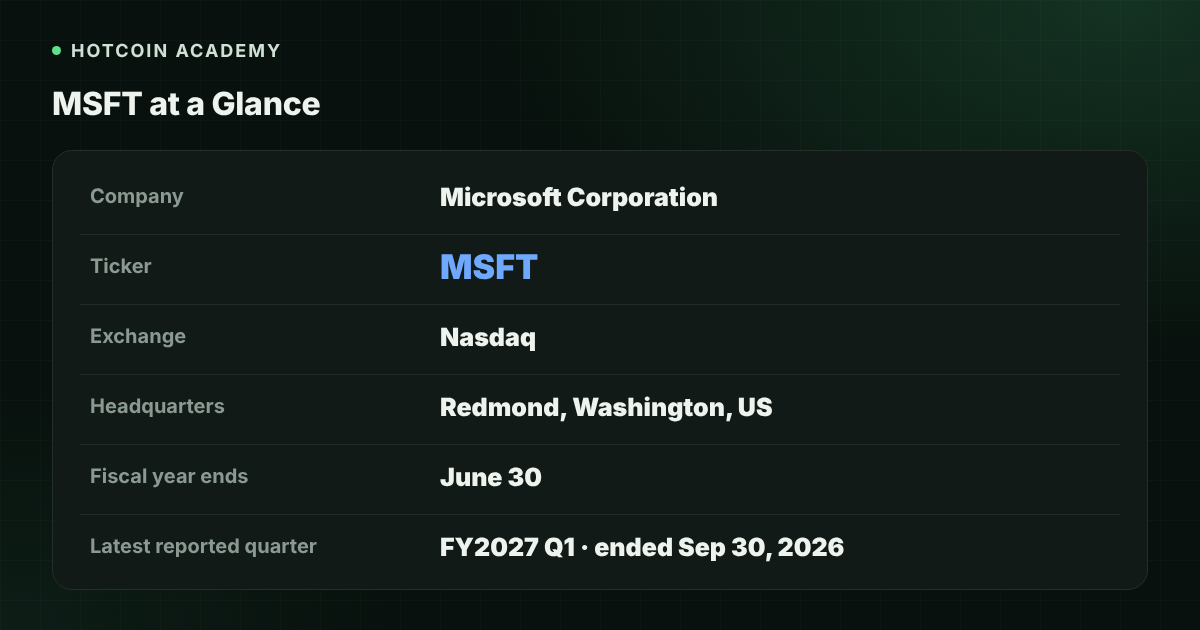
According to the FY2027 Q1 earnings release published on Microsoft's Investor Relations website on October 28, 2026, quarterly revenue was $92.3 billion, up 19% year over year; operating income was $45.9 billion; net income was $36.629 billion, and diluted EPS was $4.92. The release also reported non-GAAP net income of $36.422 billion and non-GAAP diluted EPS of $4.89, excluding the impact of the OpenAI investment. That investment had a net positive impact of $207 million on net income for the quarter, or $0.03 per share. Non-GAAP figures do not replace GAAP results. These numbers come from the company's published release; subsequent quarters will update them, so refer to the latest filing.
What Businesses Does Microsoft Make Money From Now?
In September 2026, Microsoft announced a change to its segment structure starting with fiscal year 2027 and restated prior-period data under the new basis. The two current segments are below. When reading third-party quotes or company profiles, note that some pages may still use the previous three-segment names (Productivity and Business Processes, Intelligent Cloud, More Personal Computing). That is the old basis; rely on the company's latest earnings release and financial statements.
| Segment | What it mainly includes | FY2027 Q1 revenue |
|---|---|---|
| Agents and Infra | Azure, Microsoft 365 cloud, productivity and server licenses, industry solutions, and Frontier and support services, among others | $76.8 billion, up 25% year over year |
| Devices and Consumer | Search and advertising, Xbox, Windows OEM and devices, among others | $15.5 billion, down 3% year over year |
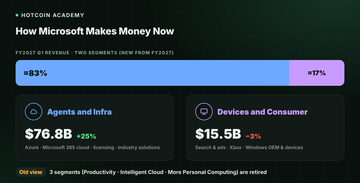
The same release also provided more granular product-line revenue. For example, Azure was $33.2 billion in the quarter, up 48% year over year; Microsoft 365 cloud was $27.8 billion; and Microsoft Cloud revenue was $63.9 billion, up 30% year over year. The release states that Microsoft Cloud includes Azure, Microsoft 365 commercial cloud, and industry solutions cloud. Microsoft 365 cloud and "Microsoft 365 commercial cloud" are not necessarily the same basis, and the release did not give a separate absolute figure for industry solutions cloud. Therefore, do not add up product-line numbers yourself and compare the total to Microsoft Cloud's $63.9 billion. Use the release's aggregate Microsoft Cloud figure. These breakdowns help explain the revenue structure; they cannot be directly converted into a "fair stock price."
How to Read MSFT's Live Chart
The "live chart" on a quote page generally comes from securities-market trading data. When reading it, follow these steps:
- Confirm the time window first: US regular trading hours are 9:30 to 16:00 New York time. The corresponding Beijing time differs by 12 or 13 hours depending on daylight saving time, so follow the time zone labeled on the page.
- Distinguish the latest price from the closing price: The latest price is the most recent trade and moves continuously during the session. The change is usually calculated against the previous trading day's official close. Pre-market and after-hours trades often have weaker liquidity and wider spreads, so do not treat them as a confirmed closing result.
- Also look at volume and the day's range: Volume, the day's high, and the day's low can help gauge whether volatility is active, but they alone do not prove a trend has formed.
- Watch for dividends and splits: If the company pays dividends or splits its stock, an unadjusted chart may show gaps. When comparing long-term trends, confirm whether the page uses adjusted prices.
- Do not hard-code a moment's number: Stock prices change constantly. This section only explains how to read them; see the live display on the page for specific figures.
How to Read Market Cap
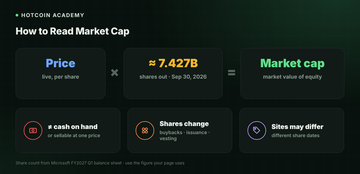
Market capitalization is generally estimated as follows:
Market cap ≈ current share price × shares outstanding
The share count follows the basis used on the quote page. It is commonly issued and outstanding common shares, and may differ slightly depending on whether diluted shares are included. Microsoft's balance sheet at the end of FY2027 Q1 listed about 7.427 billion issued and outstanding common shares (as of September 30, 2026), but subsequent buybacks, issuance, or employee exercises will change that number. Use the share count the page uses at the time of calculation.
Three common boundaries when reading market cap:
- Market cap is not the cash on the company's books, nor does it equal the amount you would get by selling all shares at the displayed price at once.
- Price moves immediately change market cap; buybacks or issuance change the share count, so market cap and share price do not necessarily move in the same proportion.
- Different sites may use different share-count dates, so calculated market caps may differ slightly. Rely on the explanation on the page you are viewing.
Common Misconceptions
- "The latest price I see is today's official closing price": Only the official closing price after regular hours is typically the basis for the daily change; pre-market and after-hours prices are a separate session.
- "Market cap equals the cash or realizable assets Microsoft owns": Market cap is the market valuation of equity and is not directly equivalent to cash, inventory, or office buildings.
- "Azure revenue is all of Microsoft Cloud": Microsoft Cloud in the release also includes Microsoft 365 commercial cloud and industry solutions cloud; Azure is only one part.
- "The highest-revenue business line means the stock will definitely rise": Cloud businesses such as Azure carry large weight, but the stock is also affected by interest rates, valuation, spending plans, and market risk appetite. Revenue structure alone is not a buy or sell signal.
- "A big year-over-year change in net income means cloud profit doubled or halved in sync": The quarter's release also lists the impact of the OpenAI investment on net income, so distinguish the basis before comparing profits.
FAQs
Q1: On which exchange is MSFT listed? MSFT is the ticker for Microsoft Corporation's common stock listed on Nasdaq; the company's full name is Microsoft Corporation.
Q2: What business segments does Microsoft have now? Starting with fiscal year 2027, Microsoft reorganized its operating segments into Agents and Infra and Devices and Consumer, and restated prior-period data under the new basis. Specific products still include Azure, Microsoft 365, Windows, Xbox, and search advertising, among others; refer to the company's latest financial statements.
Q3: How is MSFT's market cap calculated? Generally, current share price multiplied by shares outstanding. Share count changes with buybacks, issuance, and employee exercises; the market cap on the page is calculated by the system using the data at that time, so rely on the quote page display.
Q4: Do pre-market or after-hours moves count as the official closing result? No. Pre-market and after-hours are extended trading sessions with typically thinner volume, and price moves there are not directly equivalent to the official closing price.
Q5: Can I tell whether MSFT is expensive just by looking at the stock price? No. The stock price alone does not account for share count, earnings, growth, or valuation levels. Even combined with market cap, you still need to compare financial data and risks; do not treat the current price as a conclusion that it is "cheap" or "expensive."
Conclusion
MSFT is the ticker for Microsoft's stock listed on Nasdaq. To read this stock, first confirm the company's current business segments and the revenue structure of its latest reported quarter, then return to the quote page to read the live price, change, and market cap. These numbers change with the market; rely on the live display and the company's latest releases.
If you also want to distinguish what "price" and "market cap" each explain—and do not explain—you can start with What Are Market Cap, Circulating Supply, and Fully Diluted Valuation (FDV)?.
Risk disclaimer: This article is for educational and informational purposes only and does not constitute any investment advice or a recommendation to buy or sell. Financial figures come from the company's published financial statements or earnings releases and may be updated by later filings. US stock prices are highly volatile and may cause partial or total loss of principal. Please rely on the company's latest releases and the real-time data on your page, and make decisions carefully based on your own risk tolerance.
Recommended
View more