Golden Cross and Death Cross: Practical Moving Average Crossover Signals
Golden crosses and death crosses are among the most recognized trend-confirmation signals in moving average systems. A golden cross occurs when a short-term moving average rises above a long-term moving average, suggesting strengthening momentum and a possible uptrend. A death cross occurs when the short-term average falls below the long-term average, pointing to fading momentum and greater downside risk. Crypto traders often use these signals as references when evaluating shifts between bullish and bearish market conditions.
Core Definitions of Golden and Death Crosses
What Is a Golden Cross?
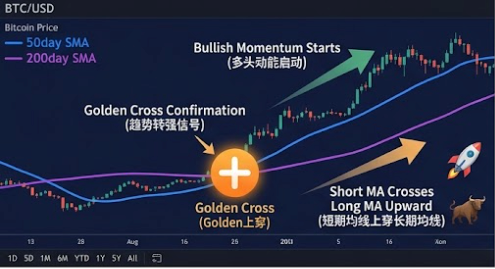
A golden cross forms when a short-term moving average crosses above a long-term moving average. The best-known configuration is the 50-day moving average crossing above the 200-day moving average. The 50-day average reflects shorter-term market sentiment, while the 200-day average is widely viewed as a boundary between bull and bear markets. An upward crossover indicates that short-term momentum has overtaken the longer-term trend, potentially signaling an exit from bottom consolidation and the start of an advance.
Different moving average combinations can be selected for different trading scenarios:
What Is a Death Cross?
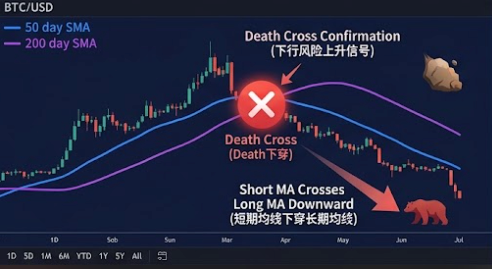
A death cross is the opposite of a golden cross: the short-term moving average crosses below the long-term moving average. Using the same 50-day and 200-day combination, a drop by the 50-day average below the 200-day average suggests heavy short-term selling pressure and a possible transition from a bull market to a bear market. Historically, the Dow Jones Industrial Average formed a death cross before the 1929 market crash.
Market Meaning and Trading Strategies
How Traders Use a Golden Cross
A golden cross is commonly interpreted as a bullish signal, suggesting that price may be leaving a bottoming range. In practice, the crossover itself matters less than confirmation from trading volume. A reliable golden cross often comes with a significant increase in volume, indicating genuine capital inflows; without sufficient volume, the breakout may fail. After a golden cross forms, the long-term moving average often becomes an important support level.
How Traders Use a Death Cross
A death cross signals weakening market momentum and may serve as a reference for reducing exposure, setting stop-losses, or opening short positions. Once the death cross is confirmed, the long-term moving average often becomes resistance during price rebounds.
How Can You Identify False Crossovers?
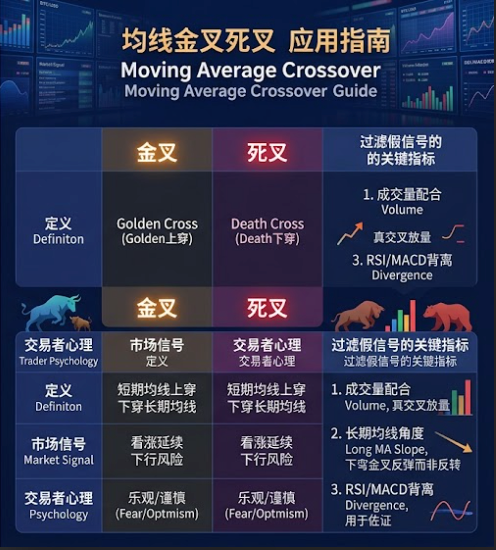
Crossover signals are not 100% accurate. A false golden cross occurs when the short-term moving average briefly breaks above the long-term average, then quickly reverses and falls below it again. Traders who enter solely on this signal may suffer losses. Key ways to identify false signals include:
- Volume confirmation: genuine crossovers usually come with clear volume expansion, while false crossovers often lack volume
- Moving average slope: if the long-term average is still sloping downward, a short-term golden cross may represent only a rebound rather than a reversal
- Whipsaw behavior: a rapid reversal after the crossover suggests that short-term volatility, rather than sustained bullish strength, caused the signal
How Crossover Signals Differ by Timeframe
Golden and death crosses can be observed on any timeframe, but their reliability varies considerably:
- Daily chart (1D): generally the most reliable, aligned with macro trends, and suitable for medium- to long-term analysis
- Four-hour chart (4H): useful as a medium-term reference for swing traders
- One-hour chart and below: contains more short-term noise, making signals more prone to distortion and requiring greater caution
Crossover signals are lagging indicators, which means price has often already moved substantially before the crossover appears. Shortening the moving average periods, such as using 50/100 days instead of 50/200 days, can improve responsiveness but also increases the frequency of false signals. Experienced traders combine crossovers with MACD, RSI, or volume to confirm the underlying trend.
Historical Validation and Reliability
Golden and death crosses are not perfect prediction tools, but they have demonstrated value in identifying long-term trend changes. In Bitcoin's history, several major trend reversals have coincided with golden or death crosses of the 50-day and 200-day moving averages. However, these signals can become unreliable in sideways or low-volume markets. Traders can filter false signals by looking for stronger volume, RSI divergence, or a matching MACD crossover.
The core principle is to treat a golden or death cross as a trend filter rather than an execution signal. Use it first to determine whether the broader market backdrop is bullish or bearish, then combine it with other tools to identify a specific entry.
Frequently Asked Questions (FAQ)
Q1: Does Price Always Rise After a Golden Cross?
No. A golden cross is a lagging indicator, so part of the rally has often already occurred by the time it forms. False golden crosses may appear during consolidation or in low-volume conditions. Confirming the signal with volume and other indicators can improve its reliability before entering a trade.
Q2: Does a Death Cross Always Mean a Bear Market Is Coming?
Not necessarily. Although a death cross is often associated with the early phase of a bear market, sideways conditions can produce false death crosses followed by a rapid recovery. If the long-term moving average is still sloping upward, the bearish signal is less reliable.
Q3: Are Golden and Death Crosses Used Only with Moving Averages?
No. The same concepts apply to indicators with fast and slow lines, including MACD and KDJ. In MACD, a DIF line crossing above the DEA line can be treated as a golden cross, while a move below it can be treated as a death cross. Each indicator has a different purpose and signal meaning, so its specific context must be understood.
Q4: Which Moving Average Pair Should Beginners Use?
A 20-day and 50-day combination is a practical starting point. It responds more quickly than a 50/200-day setup while remaining steadier than ultra-short-term combinations. Adding volume and RSI as secondary confirmation can filter out some false signals.
Related Tutorials:
- Beginner's Guide to Crypto Technical Analysis: From Candlesticks to a Trading System
- Moving Averages Explained: Using MA and EMA to Identify Trends
- MACD Explained: Trend Following and Divergence Signals
- RSI Guide: Trading Overbought and Oversold Conditions
- Support and Resistance: Finding Key Price Zones
- Volume Analysis: Reading the Price-Volume Relationship
- Classic Chart Patterns: Head and Shoulders, Double Tops, Triangles, and More
Recommended Reading:
Recommended
View more