Daily Cryptocurrency Market Report – November 16

Author kim
Key Points
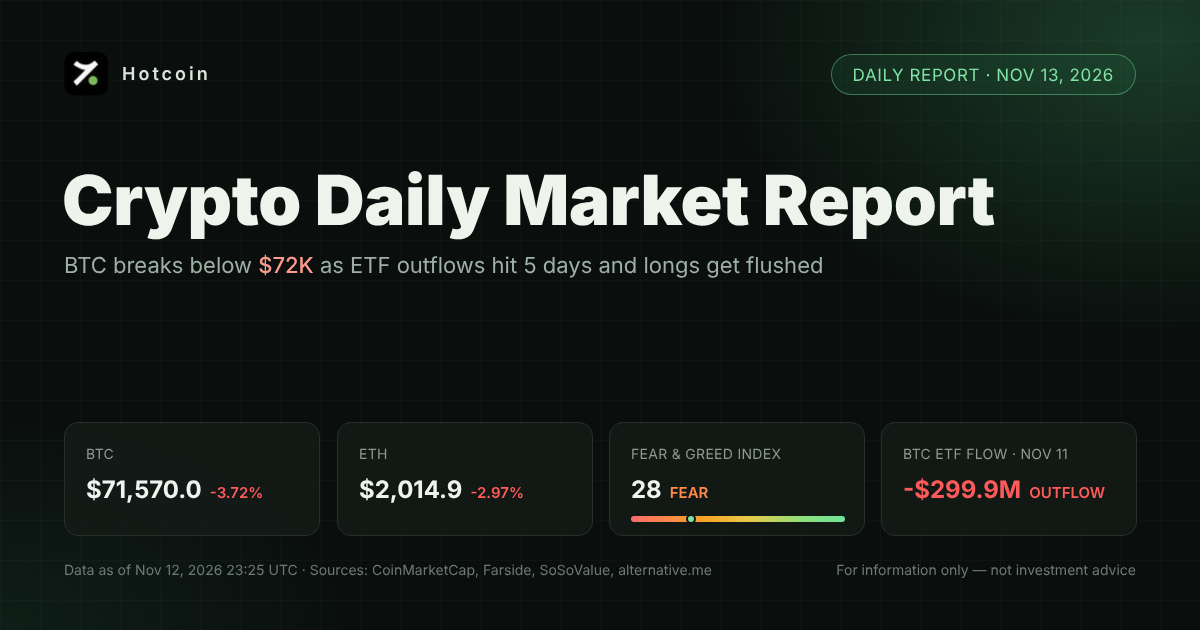
① Price trend: BTC briefly fell to around $62,000 over the weekend, its lowest level since July, before rebounding; it is currently at $64,985.84 (+2.05%). Over the past 24 hours, XRP rose 8.00%, ETH 4.49%, and SOL 4.24%, but BTC is still down about 14% cumulatively this week. Approximately $2.02 billion in positions were liquidated across the market over the weekend.
② Fund flows: The BTC spot ETF recorded net outflows of $185 million on November 13, marking the seventh consecutive trading day of outflows (following -$284 million the previous day). Net outflows totaled $1.065 billion over the past five trading days and approximately $2.347 billion so far in November. The ETH spot ETF recorded a small net inflow of $2.36 million on November 13, ending six consecutive days of outflows.
③ Today: China’s October industrial value-added output and total retail sales of consumer goods, Japan’s preliminary third-quarter GDP, and a speech by Fed Chair Warsh; tomorrow, U.S. October retail sales. The Fear & Greed Index fell from 13 to 10 (Extreme Fear).
Market Overview

Fear & Greed Index: 10 (Extreme Fear)
· BTC spot ETF net outflow on November 13: -$185 million
· ETH spot ETF net inflow on November 13: +$2.36 million
The weekend market experienced a “selloff first, rebound later.” According to The Block BTC briefly fell to around $62,000 from Saturday into early Sunday, its lowest level since July, before recovering to around $64,910 on Sunday evening; it was down approximately 14.2% for the week. Over the same period, ETH fell about 18.2% for the week, while SOL fell about 19.7%.CryptoTicker recorded an intraday low of $61,946 on Coinbase, followed by a rebound of approximately 5% within one hour.
The liquidation of leveraged positions was key to accelerating the decline. Citing CoinGlass hourly data, The Block reported that approximately $2.02 billion in positions were liquidated across the market from 8:00 a.m. Saturday to 8:00 a.m. Sunday Eastern Time, including $1.68 billion in long positions and $342 million in short positions. According to statistics from CryptoTicker citing TokenPost approximately $691 million in positions were forcibly liquidated within the hour after BTC fell below $64,000. Rumors circulated that Binance was selling, but Binance co-founder Changpeng Zhao denied this on X, saying that Binance had not sold any crypto assets.
At the macro level, after October CPI rose 0.4% month over month (versus expectations of 0.3%), market expectations for a rate hike strengthened: CryptoTicker, citing CME FedWatch data, reported that the probability of a 25-basis-point rate hike in December was approximately 88.5%. The October PPI, released Friday, rose 0.3% month over month, slightly below the expected 0.4%, but failed to reverse hawkish expectations. According to The Sunday Crypto Desk Citing Glassnode data, as of 11/9, the 30-day decline in stablecoin supply was approximately $14.2 billion, marking the fastest contraction since June 2022, with the market’s “ammunition” shrinking in tandem.
On the capital front, according to TokenPost citing SoSoValue, spot BTC ETFs recorded net outflows of $185 million on 11/13, including -$144 million for IBIT and -$41.92 million for FBTC, while the remaining 10 ETFs saw zero flows. Since 11/5, total outflows over seven days amounted to approximately $1.91 billion, and outflows so far in November were approximately $2.35 billion (CoinCentral). The Fear and Greed Index fell to 10, entering the zone of extreme fear; the rebound over the past 24 hours was driven more by short covering and an oversold recovery.

Next, two points to watch: First, whether BTC can reclaim the 200-week moving average around $67,900 (The Sunday Crypto Desk, citing CoinReporter data). If it falls below $62,000 again, the next level to watch is the year-to-date low of approximately $58,000 from early July. Second, tomorrow’s U.S. October retail sales and Wednesday’s FOMC meeting minutes will affect December rate-hike pricing, thereby influencing whether ETF fund flows can halt their consecutive outflows.
Top 10 Tokens by Market Capitalization
| Rank | Token | Price (USD) | 24h Change | Market Cap |
|---|---|---|---|---|
| 1 | BTC | 64985.84 | $1.307 trillion | |
| 2 | ETH | 1823.72 | $222.9 billion | |
| 3 | USDT | 0.9996 | $175.3 billion | |
| 4 | BNB | 594.78 | $78.2 billion | |
| 5 | USDC | 0.9998 | -0.01% | $69.1 billion |
| 6 | XRP | 0.9721 | $61.7 billion | |
| 7 | SOL | 72.28 | $42.8 billion | |
| 8 | TRX | 0.3052 | -0.38% | $29 billion |
| 9 | HYPE | 68.06 | $17.2 billion | |
| 10 | ZEC | 908.5 | $15.4 billion |
Rankings are based on CoinMarketCap's market cap rankings (excluding the CMC20 Index and staking derivative tokens), with data as of 2026-11-15 23:16 UTC; rankings may have changed amid significant volatility.
Analyst View
- Crypto Remains a Short-Term “ATM”: Richard Galvin of DACM believes that crypto assets remain a source of short-term funds for retail investors, while events such as the sale of Anthropic shares are also diverting cash (according to The Sunday Crypto Desk (Reported). The risk is that this assessment is based on funding-flow speculation; if macro expectations shift, capital inflows could return faster than expected.
- Technical decline triggers cascading liquidations: Rich Rosenblum of GSR characterized this decline as a "technical move," arguing that a break below the 200-day moving average near $73,000 triggered liquidations and additional short positions (as reported by The Sunday Crypto Desk). The risk is that once technical levels fail, if fundamental capital (ETFs and stablecoins) continues to flow out, the recovery may extend beyond a technical rebound.
The views above are from third parties and do not represent Hotcoin's position.
Key Headlines
- BTC rebounded to $64,910 after touching a four-month low of around $62,000 over the weekend. Approximately $2.02 billion in positions were liquidated across the network from 8:00 a.m. ET Saturday to 8:00 a.m. ET Sunday, including $1.68 billion in long positions; Changpeng Zhao denied that Binance was selling crypto assets (source:The Block). Short-term selling pressure eased after substantial deleveraging, but sentiment remains in extreme fear.
- BTC spot ETFs recorded approximately $1.07 billion in net outflows last week, marking a second consecutive week of outflows exceeding $1 billion. On November 13, IBIT accounted for approximately 77% of the day's outflows (sources:The Block,Cointelegraph). Weak institutional demand is one of the core factors preventing BTC from establishing a firm footing.
- ETH spot ETFs saw a small net inflow of approximately $2.4 million on November 13, ending a cumulative six-day outflow of approximately $594 million. However, they still recorded weekly net outflows of $399 million, marking the seventh consecutive week of outflows (source: The Block). The inflow was extremely small and can hardly yet be considered a turning point in fund flows.
- Kava Lend was attacked, and approximately 55.2 million KAVA tokens (about $3.76 million) were stolen. KAVA fell approximately 39% over 24 hours, while the project team said the incident was limited to Kava Lend (source:The Block). With the aftermath of the Binance incident still unfolding, ongoing DeFi security incidents continue to weigh on risk appetite.
- Stablecoin supply declined by approximately $14.2 billion within 30 days, the largest decrease since June 2022 (source: The Sunday Crypto Desk, citing Glassnode and Decrypt). The contraction in market liquidity means the rebound lacks support from incremental capital.
Today's Focus
| Time (UTC) | Event | Forecast | Previous |
|---|---|---|---|
| 2026-11-15T23:50:00.000Z | Japan Q3 preliminary GDP (quarter-on-quarter) | ||
| 2026-11-16T02:00:00.000Z | China October industrial value added above designated size (year-on-year) | ||
| 2026-11-16T02:00:00.000Z | China October total retail sales of consumer goods (year-on-year) | ||
| 2026-11-16T02:00:00.000Z | China fixed-asset investment in urban areas, January–October (year-on-year) | -7.00% | -7.20% |
| 2026-11-16T17:00:00.000Z | Fed Chair Warsh speaks | — | — |
| 2026-11-17T07:00:00.000Z | UK September three-month ILO unemployment rate | 4.70% | 4.70% |
| 2026-11-17T13:30:00.000Z | US October retail sales (MoM) | ||
| 2026-11-17T13:30:00.000Z | US October retail sales control group (MoM) |
The above covers events on 11/16 (Monday) and 11/17 (Tuesday); Eurozone data for these two days (September industrial production and November ZEW) has not yet been found with verified times and forecast values, so it is not included. Data sources: InvestingLive, Newsquawk, and LiteFinance. Announced yesterday: no important macroeconomic data on 11/15 (Sunday); the most recent release was US October PPI on 11/13 (Friday), with MoM at +0.3% (forecast +0.4%), YoY at 6.5% (forecast 6.6%), and core PPI MoM at +0.3%, in line with expectations (source: Newsquawk).
Frequently Asked Questions
What is today’s BTC price? BTC is quoted at $64,985.84 (+2.05% over 24 hours) (data as of 2026-11-15 23:16 UTC, source: CoinMarketCap).
Why did Bitcoin plunge this week? The October CPI came in above expectations, increasing bets on a rate hike in December. Combined with seven consecutive days of net outflows from spot BTC ETFs and a contraction in stablecoin supply, the price breaking below key moving averages triggered approximately $2 billion in leveraged liquidations, with BTC briefly falling to around $62,000 over the weekend.
What is the current market sentiment? The Fear and Greed Index stands at 10/100 (extreme fear), down further from 13 the previous day.
How are spot BTC ETF fund flows? There was a net outflow of $185 million on 11/13, marking the seventh consecutive trading day of outflows, with a seven-day total of approximately $1.91 billion; cumulative net outflows over the past five trading days totaled $1.065 billion.
Risk warning: This article is for informational purposes only and does not constitute investment advice; digital asset prices are highly volatile, so please carefully assess your own risk tolerance.
Related reading:
- Crypto Daily|ETF outflows continue for six consecutive days, PPI hits a nearly four-year high, BTC falls below $68,000, and the Fear and Greed Index drops to 20 (11/14)
- Crypto Daily|ETF outflows continue for five consecutive days at $1.44 billion, $656 million in long positions liquidated, BTC falls below $72,000 to a 12-week low (11/13)