Support and Resistance: How to Find Key Price Zones
Support and resistance are two cornerstones of technical analysis. Support is a price area where a decline may pause and rebound because buyers gather there, while resistance is an area where an advance may stall and reverse because sellers gather there. In essence, these zones visualize the market's collective memory and psychology. If many participants previously bought at a certain price, returning to that area can trigger new decisions. Instead of obsessing over the market's ultimate direction, first learn to recognize the levels attracting its attention.
The Logic Behind Support and Resistance
Support is a price zone where a downtrend may pause or even rebound. It forms when enough buyers consider the price attractive and enter the market, creating concentrated demand.
Resistance is a price zone where an uptrend may stall or reverse. It forms when selling pressure appears in force, whether from profit-taking or from previously trapped holders exiting at breakeven.
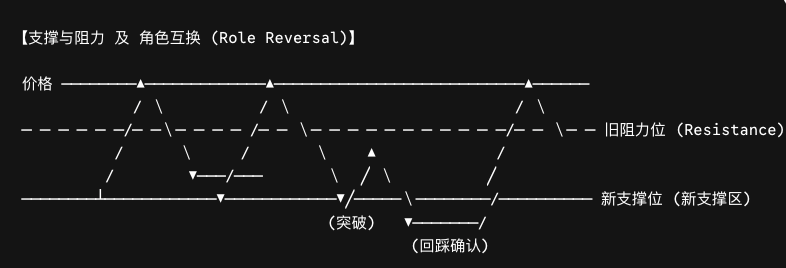
The most important principle is role reversal. After price decisively breaks above resistance, that zone often becomes new support. Likewise, after support decisively fails, it may become new resistance. Market psychology explains this behavior: traders who sold at resistance and then watched price continue higher may buy when price retests that level, turning the former “ceiling” into a “floor.”
Three Practical Identification Methods
Method 1: Find Historical Highs and Lows
This is the simplest and most widely used method. Review the chart for zones that price has touched and reacted to multiple times. Swing highs form potential resistance, while swing lows form potential support. For example, Bitcoin's all-time high near $69,000 in 2021 acted as major resistance for roughly two and a half years. It became support only after price broke above it in March 2024.
Remember that support and resistance are not lines precise to the decimal point. They are zones. Price rarely respects one exact number and instead reacts within a range.
Method 2: Draw Trendlines and Channels
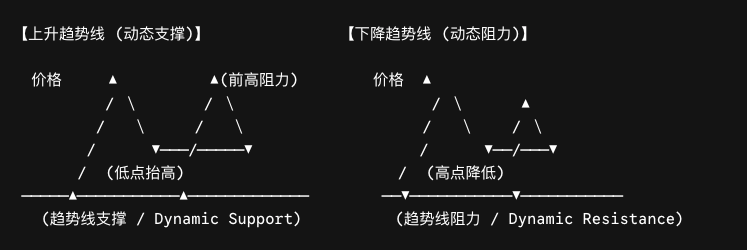
In an uptrend, connect a series of higher lows to form a rising trendline. The trendline itself acts as dynamic support. In a downtrend, connect lower highs; the resulting falling trendline acts as dynamic resistance.
When two parallel trendlines form a price channel, the upper boundary provides resistance and the lower boundary provides support. These boundaries can help plan entries and exits in range-bound markets.
Method 3: Round Numbers and Psychological Levels
Round numbers, such as $60,000 or $100,000 for Bitcoin, are among the market's most common self-fulfilling support and resistance levels. Retail and institutional traders often place orders and stops at these numbers, and that concentration of orders reinforces the levels.
How to Judge the Strength of a Level
Not every support or resistance zone deserves equal attention. Stronger levels typically have these traits:
- Multiple clear reactions: price has reversed visibly in the same zone at least two or three times
- A strong move away from the zone: the farther price rebounds after touching support or resistance, the stronger that level is
- Visibility on higher timeframes: weekly or daily levels carry more weight than levels visible only on a 15-minute chart
Weak levels tend to show only one mild reaction, small subsequent price moves, visibility only on very low timeframes, or repeated price movement through the zone.
A Four-Step Trading Strategy
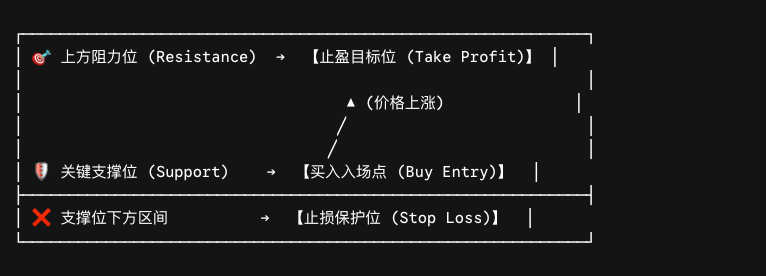
Step 1: Establish the big picture. Switch to the daily or weekly chart, mark the main support and resistance zones, and identify where the current price sits relative to them.
Step 2: Plan the entry. Look for buying opportunities near support after a confirming rebound signal, such as a candlestick pattern. Near resistance, consider reducing a position or looking for a short setup.
Step 3: Plan the exit. Use the next major resistance zone as a natural profit target for a long trade.
Step 4: Set the stop-loss. For a long trade, place the stop a reasonable distance below key support. If that zone breaks, the original entry thesis is no longer valid.
Three Limitations of Support and Resistance
They are not an exact science: these are zones rather than points. Price may test a support or resistance area repeatedly before breaking through, so entering too early can lead to a stop-out.
They can be both self-fulfilling and self-defeating: levels often work because many traders see them and place similar orders there. For the same reason, however, large market participants may deliberately push price through a level to trigger clustered stops, creating a false breakout trap.
They may fail during strong trends: in an extreme one-way market, price can break through multiple historical levels in succession. Trying to pick a bottom or top against that trend carries significant risk.
Frequently Asked Questions (FAQ)
Q1: Why do support and resistance work?
They reflect participants' collective memory and concentrated orders. People who previously bought or sold at a particular price may repeat that behavior when price returns. At the same time, many traders place pending orders and stops near the same level, and this concentration can itself produce a reaction.
Q2: Should I draw a “line” or a “zone”?
A zone is generally better. Price rarely touches one exact number and immediately reverses; it usually moves within a range. Thinking in terms of a zone rather than a line gives you room to account for normal volatility and avoids rejecting a setup because price missed one number by a few dollars.
Q3: What is role reversal, and how can I use it?
When price breaks resistance with convincing volume, that level can become future support. Conversely, broken support can become future resistance. One approach is to consider a long after price breaks resistance, retests it, and holds above it. After support breaks, a failed rebound into the former support may present a short setup.
Q4: How can I avoid false breakout traps?
Use three safeguards. First, wait for the candle to close and confirm the breakout instead of reacting immediately to a wick through the level. Second, check volume: genuine breakouts usually come with a noticeable increase, while low-volume breaks are less reliable. Third, wait for a retest; a breakout followed by a successful retest and rebound is generally more dependable than chasing price immediately.
Related tutorials:
- Technical Analysis for Cryptocurrency: From Candlesticks to a Trading System
- How to Read Candlestick Charts: A Beginner's First Lesson
- Common Candlestick Patterns and Trading Signals
- Volume Analysis: What Price and Volume Reveal About Major Market Players
- Moving Averages Explained: Using MA and EMA to Identify Trends
- MACD Explained: Trend Following and Divergence Signals
- RSI: A Practical Guide to Overbought and Oversold Conditions
Recommended reading:
Lettura consigliata
Visualizza altro