
Cryptocurrency Technical Analysis for Beginners: From Candlesticks to a Trading System
Technical analysis is a systematic method of studying historical price and volume data to anticipate future cryptocurrency price movements. Beginners should focus on three essentials: reading candlestick charts, mastering two or three key indicators, and building a basic trading-system framework. Unlike fundamental analysis, technical analysis does not examine the intrinsic value of a project. It interprets the collective behavior of market participants to help traders identify relatively high-probability entry and exit opportunities in volatile crypto markets.
Why Does Technical Analysis Work for Cryptocurrency?
Technical analysis assumes that price fluctuations are not entirely random; they reflect the collective psychology and behavior of market participants. Once a trend forms, it often continues for some time. Historical evidence shows that Bitcoin bull and bear cycles can last for months or even years. Academic research has also found relatively strong price persistence in crypto markets, providing a basis for trend-following strategies.
Unlike stock markets, crypto trades around the clock and often overreacts to news. Charts can therefore serve as a comparatively objective reference for decisions. The real value of technical analysis is not “predicting the future,” but replacing subjective judgment with visual data so you can understand what is happening now.
Step 1: Learn to Read Candlestick Charts
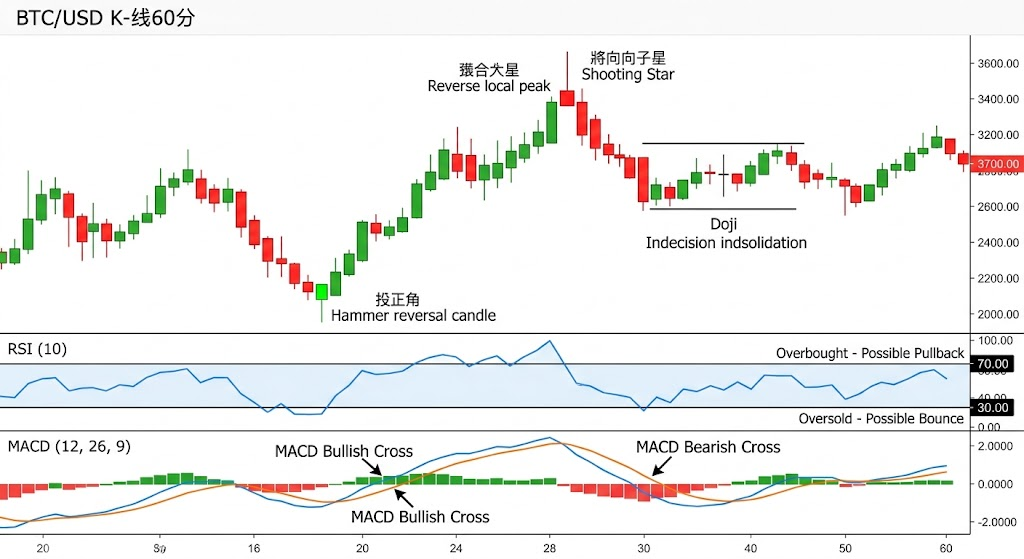
Candlestick charts are the foundation of technical analysis. Each candle contains four key data points: open, high, low, and close, commonly abbreviated as OHLC.
A candle has two main parts. The body is the rectangle between the opening and closing prices. Green or white usually means the close was above the open and buyers dominated; red or black means the close was below the open and sellers dominated. The wicks are the thin lines extending from the body: the upper wick reaches the high and the lower wick reaches the low.
After understanding individual candles, learn to recognize key patterns. Three of the most practical are:
- Hammer: a small body with a long lower wick. Sellers pushed the price down, but buyers recovered the loss, which may signal a bullish reversal near a bottom.
- Shooting star: a small body with a long upper wick. Buyers drove the price higher before sellers took control, which may signal a bearish reversal near a top.
- Doji: the opening and closing prices are nearly identical. It reflects market indecision and often appears before a trend change.
The arrangement of multiple candles matters more than any single candle. A sequence of higher highs and higher lows indicates an uptrend; lower highs and lower lows indicate a downtrend; alternating short bodies and long wicks often indicate consolidation while the market waits for a breakout.
Step 2: Core Technical Indicators and Practical Uses
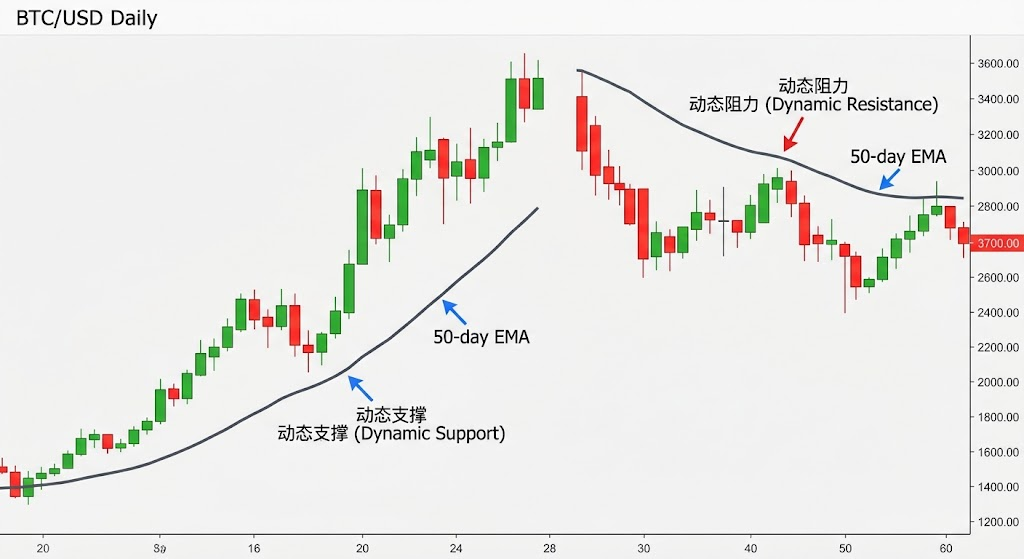
Indicators are the second piece of technical analysis. They simplify complex price information into intuitive signals. Beginners should start with the following three indicators instead of stacking numerous tools.
Moving averages (MA): Moving averages help identify trend direction and smooth out price noise. A simple moving average (SMA) calculates the arithmetic mean of closing prices over a period, while an exponential moving average (EMA) assigns more weight to recent prices and responds faster. The 50-day and 200-day moving averages are among the most widely used. A 50-day average crossing above the 200-day average, known as a golden cross, is generally considered bullish. A 50-day average crossing below the 200-day average, known as a death cross, may signal a bear market. Moving averages can also act as dynamic support and resistance: rising averages often support price, while falling averages tend to resist it.
Relative Strength Index (RSI): RSI is a momentum indicator that measures the speed and magnitude of price changes on a scale from 0 to 100. An RSI above 70 generally suggests overbought conditions and a possible pullback, while a reading below 30 suggests oversold conditions and a possible rebound. In a strong trend, however, RSI can remain overbought or oversold for an extended period, so it should not be used as a standalone buy or sell signal.
MACD (Moving Average Convergence Divergence): MACD uses the relationship between two moving averages to assess trend strength and changes in direction. The MACD line, or fast line, crossing above the signal line, or slow line, is bullish; crossing below it is bearish.
Support and resistance: These price concepts are as important as technical indicators. Resistance is a “ceiling” that price has tested several times without breaking, while support is a “floor” that price has approached without falling through. When price breaks resistance on strong volume, that level may become new support. Conversely, broken support may become new resistance. Traders use these key levels when planning entries and stop-losses.
Step 3: Build Your First Trading System
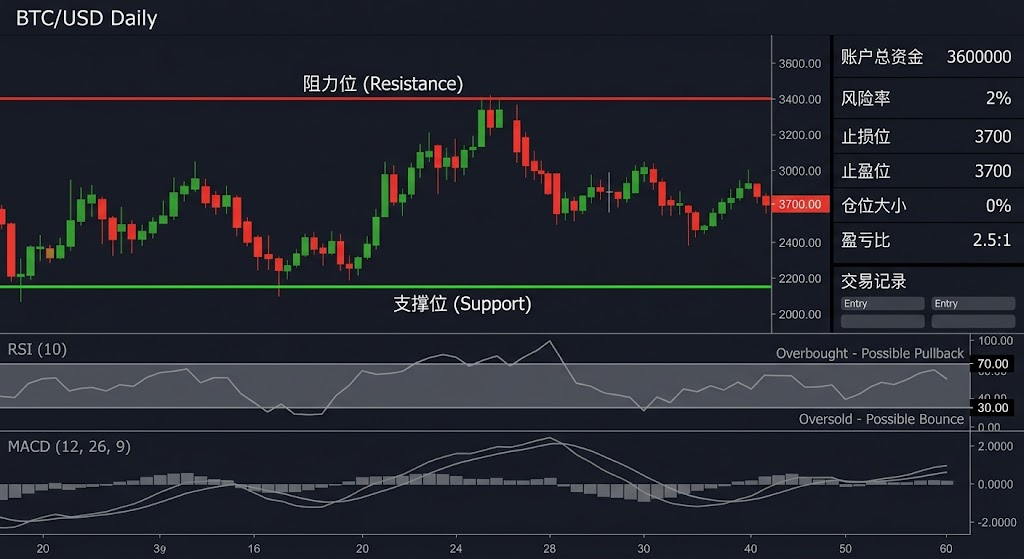
After learning the tools, combine them into an executable trading system. A beginner’s system should contain at least three elements:
Entry rules: Define the exact conditions for opening a position. For example: “Consider buying when the 50-day moving average crosses above the 200-day moving average to form a golden cross and RSI is above 50, confirming bullish momentum.” Rules must be clear and unambiguous.
Exit and risk-control rules: Take-profit and stop-loss rules are essential for protecting an account. Every trade should have a predetermined stop, such as exiting after price breaks recent support or the loss reaches 2% of capital. It should also have a profit target, such as the next resistance level or a 2:1 reward-to-risk ratio.
Position sizing: A common standard is to risk no more than 1–2% of total account capital on a single trade. This helps prevent a series of losses from severely damaging the account.
A note for beginners: charts express probabilities, not certainties. Even textbook patterns can fail completely. News can invalidate an otherwise clear signal in an instant, and the market’s reaction to news is often more important than the news itself. Start with paper trading or a very small position. Test your rules for at least one or two months before committing meaningful capital.
Frequently Asked Questions (FAQ)
Q1: Which Is More Important, Technical or Fundamental Analysis?
They serve different purposes. Technical analysis focuses on price action and market sentiment, making it useful for timing entries and exits. Fundamental analysis evaluates an asset’s intrinsic value and long-term potential. Short-term trading relies more heavily on technical analysis, while long-term investing generally benefits from combining both.
Q2: How Many Technical Indicators Should I Use?
Mastering a few tools is better than using many poorly. Beginners can start with three or four indicators, such as RSI, MACD, and moving averages. Too many indicators often produce conflicting signals and decision paralysis. Master the core tools first, then expand gradually.
Q3: What Are Support and Resistance?
Support is a price level where a decline may stop and reverse because buyers are concentrated there. Resistance is a level where an advance may stall because sellers are concentrated there. They are essentially psychological price levels. A break of major support or resistance often occurs with higher volume and may begin a new market move.
Q4: Can Technical Analysis Guarantee Profits?
No. Technical analysis aims to improve probabilities and decision quality, not guarantee that every trade will be profitable. High volatility and unexpected events, including regulatory changes and black swans, can invalidate any technical signal. Successful trading depends on technical analysis, strict money management, and consistent discipline working together.
Related Tutorials
- Cryptocurrency Technical Analysis for Beginners: From Candlesticks to a Trading System
- How to Read Candlestick Charts: A Beginner’s First Lesson
- Moving Averages Explained: Using MA and EMA to Identify Trends
- MACD Explained: Trend Following and Divergence Signals
- RSI Guide: Trading Overbought and Oversold Conditions
- Bollinger Bands Strategy: Trading Volatility
- KDJ Stochastic Indicator: A Tool for Short-Term Trading
- Support and Resistance: Finding Key Price Zones
- Volume Analysis: What Price-Volume Relationships Reveal
- Classic Chart Patterns: Head and Shoulders, Double Tops, Triangles, and More
- Fibonacci Retracement: Finding Precise Entry Levels
- How to Build Your Own Technical-Analysis Trading System
- Applying Elliott Wave Theory to Crypto Markets
- Ichimoku Cloud: Lessons from Japanese Trading
- Indicator Confluence: A Multi-Indicator Trading Strategy
Recommended Reading
Lettura consigliata
Visualizza altro



Service@hotcoin.com
Product@hotcoin.com
Business@hotcoin.com
Casecn@hotcoin.com