AHR999 Index Explained: A Guide to Bitcoin DCA and Accumulation
The AHR999 index is a classic metric for judging whether Bitcoin is trading in a range suited to dollar-cost averaging or long-term accumulation. By combining short-term DCA cost with long-term valuation, it helps investors judge how high or low the current price really is.
In long-term Bitcoin investing, many people ask whether now is a good time to start buying gradually. The AHR999 index was designed as a reference tool for exactly that question. It is not a short-term buy or sell signal; it is a valuation and positioning metric built around the DCA and accumulation mindset. This article explains what AHR999 is, how it is calculated and read, and what to watch out for in practice.
What Is the AHR999 Index
The AHR999 index was proposed by investors in the Chinese-language crypto community, mainly to support Bitcoin DCA and long-term accumulation decisions.
It combines two dimensions:
DCA cost dimension: how the current price compares with the average cost of dollar-cost averaging over a recent period
Long-term valuation dimension: how the current price compares with Bitcoin's expected growth or a historical fitted valuation
Together they produce a single readable number, used to judge whether the market is broadly in an "undervalued, buy more" zone, a "normal DCA" zone, or a "relatively expensive, be careful" zone.
The Core Idea Behind AHR999
AHR999 is not about whether the price rises or falls tomorrow. It asks:
If you keep dollar-cost averaging, is the current price expensive
From a long-term holding perspective, does it still offer good accumulation value
It therefore suits DCA investors and long-term holders far better than short-term traders.
How to Read the Value Ranges
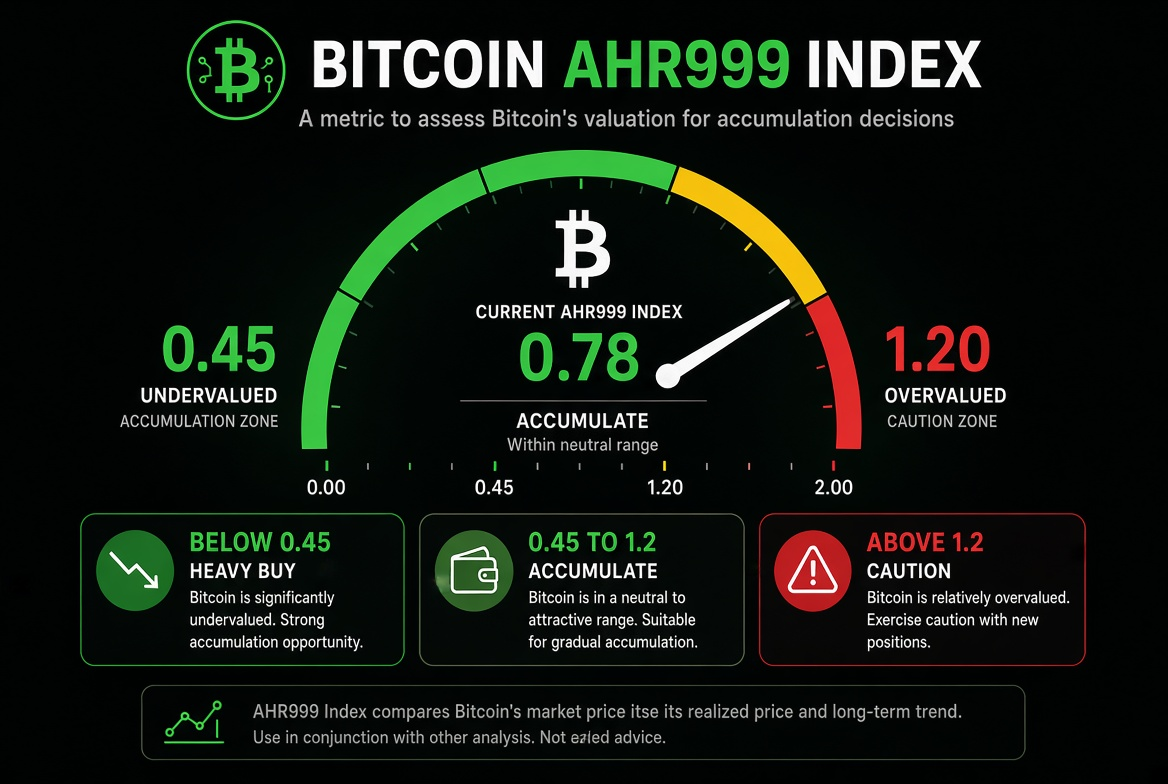
Different sources draw the ranges slightly differently. A common reference is:
Below about 0.45: historically more attractive, often seen as a zone for increasing DCA or focusing on accumulation
About 0.45–1.2: a relatively reasonable zone, or one where DCA can continue
Above about 1.2: the price is relatively high, so DCA calls for more caution, perhaps a lower frequency or a controlled position size
Note: these ranges are empirical divisions, not absolute buy or sell orders. Bitcoin's valuation midpoint can shift from cycle to cycle, so the metric should be read dynamically.
How to Use AHR999 in Decisions
Ways it is suitable to use:
As a reference for DCA pacing: buy a little more in undervalued zones, a little less when the price is high
Combine it with your own long-term plan instead of timing the market frequently
Read it alongside other metrics such as the rainbow chart, MVRV, realized price, and the Fear & Greed Index
Watch the direction of the trend rather than fixating on one exact number
Ways it is not suitable to use:
Treating AHR999 as a short-term tool for catching bottoms and tops
Going all in on a single metric
Ignoring your own risk tolerance and the time horizon of your funds
A Practical Example
Suppose someone dollar-cost averages every week:
When AHR999 sits in a lower range, stick to the plan or modestly increase the DCA amount
When the index enters a high range, keep DCA at a minimum or pause new buying and wait for a better position
Keep records throughout, so short-term price swings do not break the discipline
This approach, adjusting the intensity by position without lightly abandoning the long-term plan, is more sustainable than trying to predict tops and bottoms precisely.
Limitations and Cautions
Past effectiveness does not guarantee future effectiveness: Bitcoin's market structure, participants, and macro environment all keep changing.
Parameter and version differences: websites may handle DCA cost or the valuation curve slightly differently, so the numbers can deviate.
It cannot capture short-term liquidity shocks: in a black swan event, the price may briefly leave the metric's comfort zone.
It ignores personal circumstances: the metric does not consider your income stability, holding period, or risk tolerance.
Risk warning: AHR999 is only an auxiliary analysis tool and does not constitute investment advice. Bitcoin is extremely volatile and carries a significant risk of principal loss. Any DCA or accumulation strategy should be based on your own financial situation and risk tolerance, with preparation for long-term volatility.
FAQ
Q1: Who proposed the AHR999 index? A: It originated in the Chinese-language Bitcoin community and is often used as a reference metric for DCA and long-term accumulation.
Q2: If AHR999 drops below 0.45, must I buy heavily? A: Not necessarily. A low reading only means it has been more attractive historically; you still need to weigh your own funding arrangements and risk tolerance.
Q3: Can AHR999 be used for short-term trading? A: It is not well suited to that. It leans toward medium- and long-term positioning and is insensitive to short-term moves.
Q4: Why do I see different AHR999 values on different websites? A: Possibly because of different data sources, DCA cost windows, or valuation model details. It is best to follow the trend using one consistent source.
Q5: How should a beginner use AHR999 correctly? A: Treat it first as a "DCA intensity dial" rather than a buy or sell switch, and pair it with position management and long-term holding discipline.
Lettura consigliata
Visualizza altro