Crypto Liquidation Heatmap: How to Read Real-Time Liquidation Levels
A crypto liquidation heatmap uses color density to show estimated forced liquidation volume around different prices, helping traders spot high-risk support and resistance zones and potential cascade liquidation levels.
In futures markets, large amounts of leveraged positions cluster around certain prices. Once price reaches those areas, dense forced liquidations can be triggered and amplify volatility. A liquidation heatmap visualizes these potential liquidation levels. This guide explains what it is, how to interpret it, and how to apply it in practice.
What Is a Liquidation Heatmap
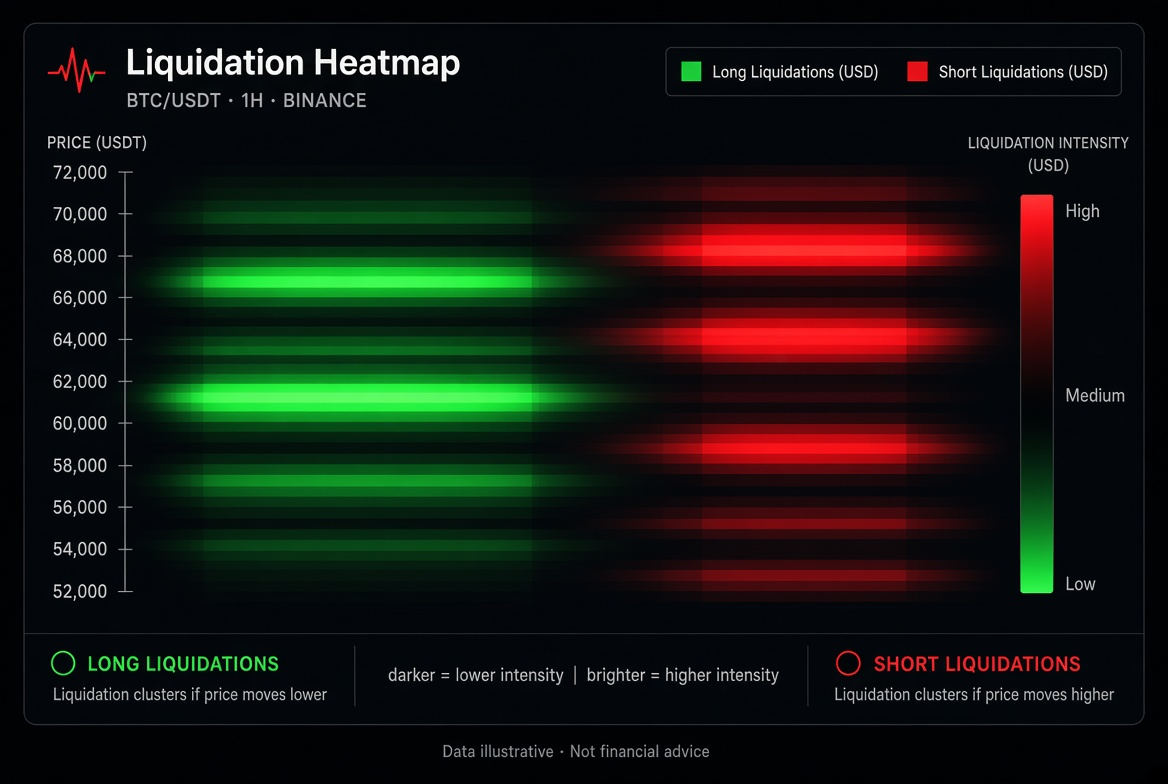
A liquidation heatmap is a chart that plots estimated liquidation data on a price axis.
How it is usually presented:
The horizontal or vertical axis corresponds to price
Color intensity represents the estimated liquidation size near that price
Brighter or deeper areas mean more long or short liquidations may be stacked there
It does not predict direction. It tells you: if price reaches this level, a large number of positions may be forced to close.
What the Heatmap Tells You
Potential support and resistance A dense long liquidation zone below means a drop toward it may trigger buying or a short-term bounce; a dense short liquidation zone above works the opposite way.
Liquidity hunting areas Price sometimes sweeps through dense liquidation zones first, clearing out leveraged positions before truly choosing a direction.
Volatility expansion points The more concentrated the liquidations, the more likely price accelerates once it touches them.
Crowding between longs and shorts When liquidation volume on one side is clearly higher than the other, leverage may be more crowded in that direction.
How to Read a Real-Time Liquidation Heatmap
Step 1: Check where price is now Identify which liquidation bands sit above and below the current price.
Step 2: Separate long and short liquidations
Liquidations below price are mostly long liquidation zones
Liquidations above price are mostly short liquidation zones
Step 3: Look at color density and thickness Stronger colors and thicker bands usually mean larger estimated liquidation size around that level.
Step 4: Combine distance and speed If a liquidation zone is close to the current price and market volatility is rising, it is more likely to be triggered; zones further away serve more as medium-term reference.
Step 5: Cross-check with other tools A heatmap should be used together with:
Support, resistance and the order book
Funding rates and open interest
Volume and volatility
Higher-timeframe trend structure
Using a heatmap alone makes misjudgment easy.
Common Uses in Practice
Stop-loss sweep reference If your stop-loss sits just outside an obvious dense liquidation zone, it may be swept faster. Consider moving it to a more structurally sound level.
Volatility warning As price approaches a large liquidation zone, stay alert to accelerating moves and control leverage and position size.
Watching short-term reaction zones Some traders watch how price reacts after entering a liquidation zone: a brief spike, an immediate reversal after the sweep, or continued trend acceleration.
Avoiding crowded trades If one side has a very thick liquidation band, leverage is crowded in that direction and chasing price carries higher risk.
Limitations and Common Misconceptions
A heatmap is an estimate, not precise orders Platforms use different statistical methods, visible positions and models, so results differ.
Liquidations do not guarantee a reversal After price sweeps a liquidation zone, it may bounce or keep trending one way.
Lag and blind spots Data refresh, cross-exchange aggregation and hidden positions all affect accuracy.
It cannot replace risk management No matter how clear a heatmap looks, it cannot offset the risk of high leverage and oversized positions.
Risk notice: A liquidation heatmap is only an auxiliary analysis tool and does not constitute trading advice. Futures trading is extremely risky and may result in the total loss of your principal. Use it together with your own strategy and risk tolerance, and prioritize position and stop-loss management.
A Simple Workflow for Beginners
Open a real-time liquidation heatmap tool
Look at the nearest highlighted liquidation bands above and below the current price
Ask yourself: if price sweeps there, will volatility increase?
Then decide whether to lower leverage, adjust your stop-loss or reduce position size
Treat the heatmap as a "risk map", not a "holy grail signal".
FAQ
Q1: Where does liquidation heatmap data come from? A: Usually from exchange-reported positions, liquidation estimation models or aggregated data from multiple exchanges. Accuracy varies by tool.
Q2: If the color is darker, will price definitely hit it? A: Not necessarily. It only means potential liquidation volume in that area is large; whether price reaches it depends on the market itself.
Q3: How do I tell long liquidation zones from short liquidation zones? A: Generally, levels below price correspond to long liquidations and levels above correspond to short liquidations, but follow each tool's labels.
Q4: Can a heatmap be my main strategy? A: It works better as a supporting tool for identifying risk zones and volatility-sensitive levels, and should not be the sole basis for opening a position.
Q5: How should beginners use a liquidation heatmap most effectively? A: Mainly to avoid placing stop-losses inside obvious liquidation clusters, and to reduce risk exposure when price approaches a large liquidation zone.
Lettura consigliata
Visualizza altro