Fear and Greed Index: A Quantitative Guide to Market Sentiment
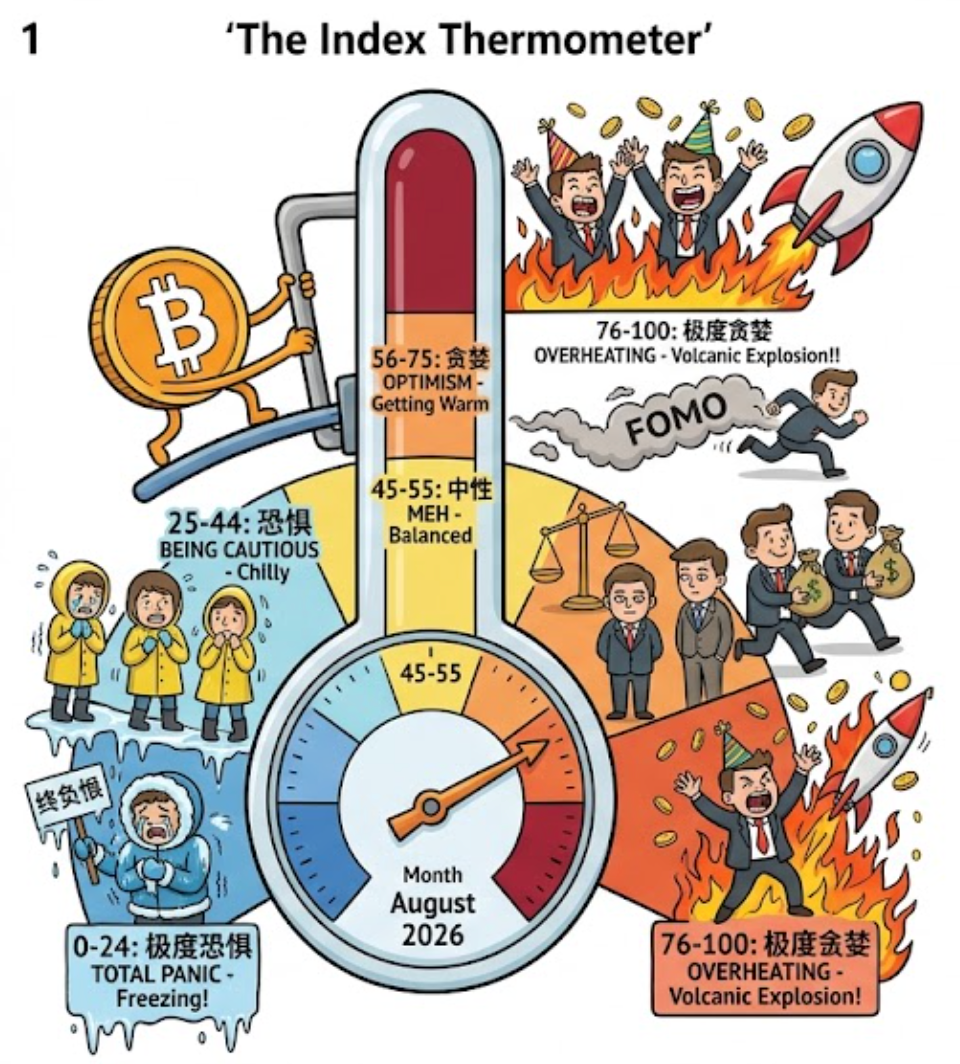
The Fear & Greed Index is a tool that turns market sentiment into a number between 0 and 100: 0-24 means extreme fear and 76-100 means extreme greed, giving you a direct read on whether the market is panic-selling or chasing a rally. Its core logic comes from Warren Buffett's famous line, "be fearful when others are greedy, and greedy when others are fearful" — when the market is gripped by extreme fear, selling power may already be exhausted, which can make it a buying opportunity; when the market is extremely greedy, the risk of chasing the top builds up fast.
How Is the Index Calculated? Six Data Inputs Behind the Sentiment Puzzle
The Fear & Greed Index is not a number pulled out of thin air. Platforms such as Alternative.me combine market data from several dimensions and calculate a weighted result. Specific formulas differ slightly from platform to platform, but the core framework is similar.
Volatility (25%): measures how far current price swings deviate from their 30-day and 90-day averages. Unusually high volatility usually signals panic, because sharp moves make traders nervous and push them into impulsive decisions.
Market momentum and trading volume (25%): compares current trading volume and price momentum with their 30-day and 90-day averages. The higher the volume and the hotter the market, the higher the greed reading. Rising prices on heavy volume in a bull market often mean greed is spreading.
Social media sentiment (15%): tracks the number of Bitcoin posts, engagement frequency and tone on platforms such as X (formerly Twitter) and Reddit. Unusually heated discussion usually goes hand in hand with greedy market behaviour and reflects the public's fear of missing out.
Surveys (15%): in its early days Alternative.me collected the market views of 2,000 to 3,000 investors through a weekly questionnaire. This dimension has now been paused, and some index platforms have replaced it with other metrics such as market breadth.
Bitcoin dominance (10%): when capital rotates from altcoins back into Bitcoin, Bitcoin's share of total market value rises, which is usually read as a risk-off (fear) signal. Conversely, when money floods into altcoins and Bitcoin's share falls, the market is chasing high-risk, high-reward assets and greed is in control.
Google search trends (10%): tracks changes in search volume for phrases such as "how to buy Bitcoin". A surge in searches usually corresponds to a spike in public attention and potential bull market sentiment.
How Do You Read the Index? From Extreme Fear to Extreme Greed
The index is usually divided into five ranges, each mapping to a different market psychology and a potential action signal:
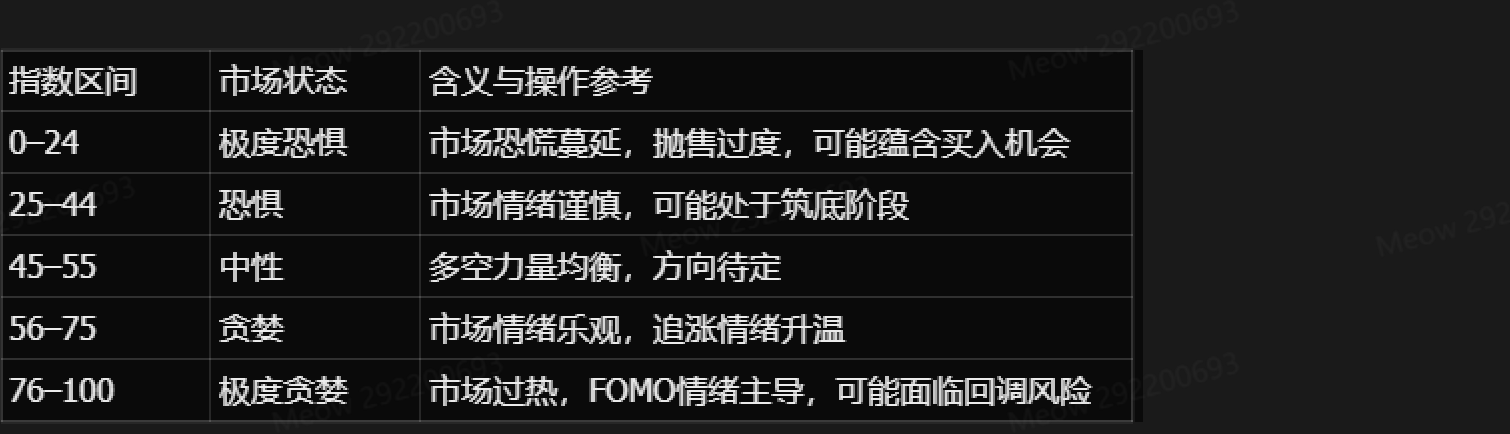
An important reminder: the index only tells you "which extreme sentiment is in play", it does not tell you directly whether to buy or sell. In August 2026 the Fear & Greed Index jumped from 27 (fear) on 12 August to 74 (greed) on 25 August — a striking move in just two weeks — while Bitcoin rocketed from $63,000 to above $80,000 and then fell back to around $78,000. The index can capture extreme shifts in sentiment, but a change in sentiment is not the same thing as confirmation of a trend.
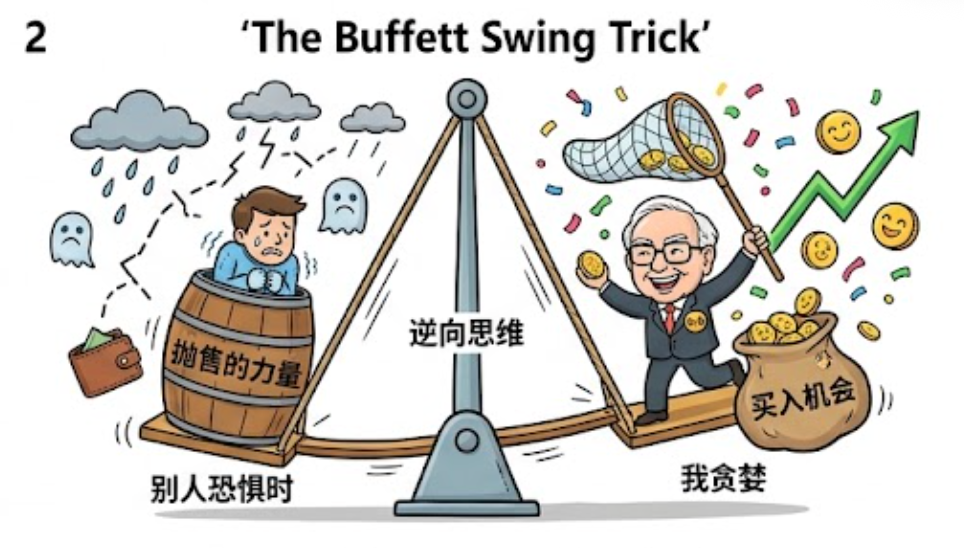
Why Does Extreme Fear Often Mark a Bottom?
Historical data shows that extreme fear often appears in the bottoming zone of a market cycle. During the 2018 bear market, the Fear & Greed Index printed 93 "extreme fear" moments over the year (a reading below 20) and fell as low as 8. When FTX collapsed in 2022, the crypto Fear & Greed Index plunged into extreme fear while the CNN index for traditional finance stayed in greed territory — evidence that crypto has its own distinct sentiment cycle.
The logic behind this is simple: when fear reaches its peak, the power of "panic selling" has already run dry — anyone who wanted to sell has sold, shorts have largely been cleared out, and at that point only a little buying interest is needed to spark a price rebound. Note the caveat: extreme fear does not guarantee an immediate rebound — the bear market that dragged on for months in 2018 shows that panic may need to build up repeatedly before it triggers a genuine trend reversal.
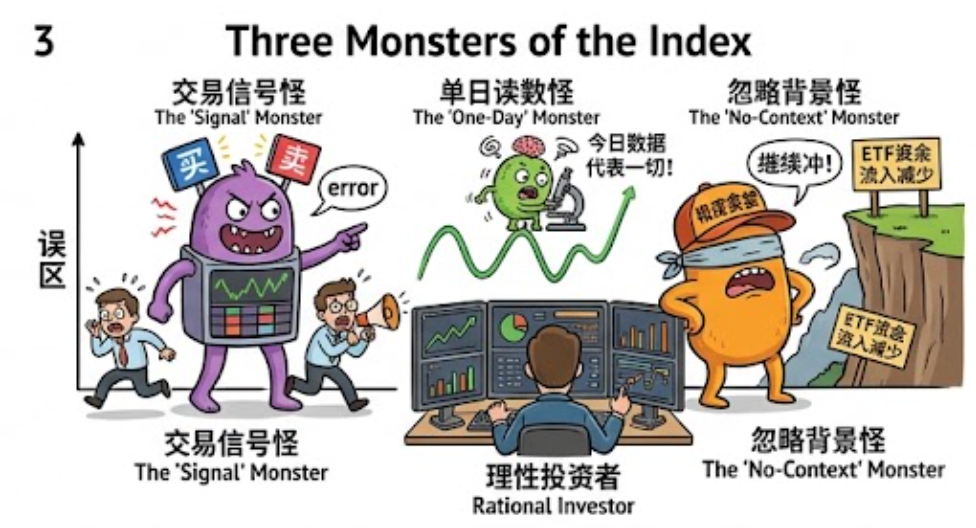
Three Common Mistakes in Practice
Mistake one: treating the index as a trading signal. The index is a mirror of sentiment, not an alarm clock for action. In extreme fear, prices can keep falling; in extreme greed, prices can keep rising. Real trading decisions need to combine price structure, support and resistance, volume and other dimensions of confirmation.
Mistake two: looking only at the single-day reading. Day-to-day index moves mean little on their own. A more useful approach is to watch the relative position of the 30-day and 365-day moving averages. When the 30-day average stays below the historical 25th percentile (roughly the 15-20 range) and then starts climbing back towards the 365-day average, history suggests this often corresponds to a bottom-accumulation zone.
Mistake three: ignoring the market context. The same "extreme greed" reading may be just a stopover in an ongoing bull trend, or a sign that a top is near in a choppy market. In late August 2026 the index reached 78 (extreme greed), but analysis suggested this was mostly short-term capital rotation and a release of sentiment; whether a real trend forms still depends on the sustainability of spot demand and ETF inflows.
FAQ
Q1: What is the difference between the Fear & Greed Index and candlestick chart technical indicators?
Candlestick charts and technical indicators (such as RSI and MACD) analyse price itself — its movement, momentum and trend. The Fear & Greed Index analyses the psychological state of market participants. It combines data beyond price (social media, search interest, capital flows and more) and reflects what people are thinking rather than what price is doing. The two look at the market from different angles and can be used together.
Q2: Does a higher index always mean prices will fall?
Not necessarily. In a strong bull trend the market can stay in "greed" or even "extreme greed" for a long time while prices keep rising. The index reflects the current state of sentiment, not the future direction of price. Extreme greed is a warning about the risk of chasing a rally, not a signal to sell immediately.
Q3: Which platforms show the Fear & Greed Index?
The main platforms are: Alternative.me (the earliest crypto version, updated daily), CoinMarketCap (currently the most widely used reference, which replaced the paused survey dimension with market breadth) and CoinGlass (which adds derivatives data such as funding rates and liquidation volumes). Algorithms and weights differ slightly between platforms, so readings can vary a little — it is best to consult several sources.
Related tutorials:
Crypto Market Cycle Analysis: From Bull-Bear Transitions to Sector Rotation
On-Chain Data for Beginners: Exchange Inflows and Outflows, MVRV, NUPL
Bitcoin Halving Cycles Explained: The Wealth Code of the Four-Year Rhythm
Recommended reading:
Inirerekumendang pagbabasa
Tingnan ang higit pa