What Are Bollinger Bands? Parameters and How to Use Them
Price touches the upper Bollinger Band, so you think it is "too expensive" and short it—then price keeps climbing along the upper band. The most common misuse of Bollinger Bands is treating the upper and lower boundaries as ceilings and floors that cannot be broken.
Bollinger Bands change width with recent price and volatility. To understand them, first judge whether the market is trending or ranging, then interpret what touching a band, a squeeze, and a breakout each mean.
Key Takeaways
- Bollinger Bands consist of a middle, upper, and lower band; the common setting is 20 periods and 2 standard deviations.
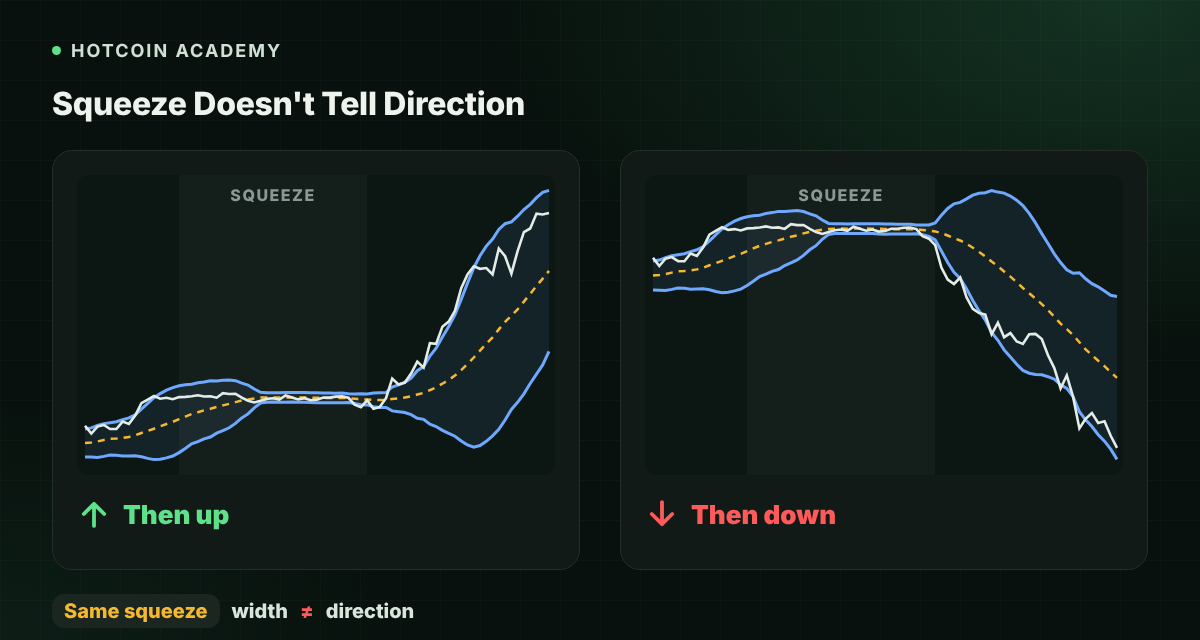
- A narrowing bandwidth means recent volatility is low; it cannot tell you whether the next move is up or down.
- Price touching the upper or lower band is not, by itself, a buy or sell signal.
- In a trend, price may walk the band; in a range, watch out for the range suddenly failing.
What Are Bollinger Bands
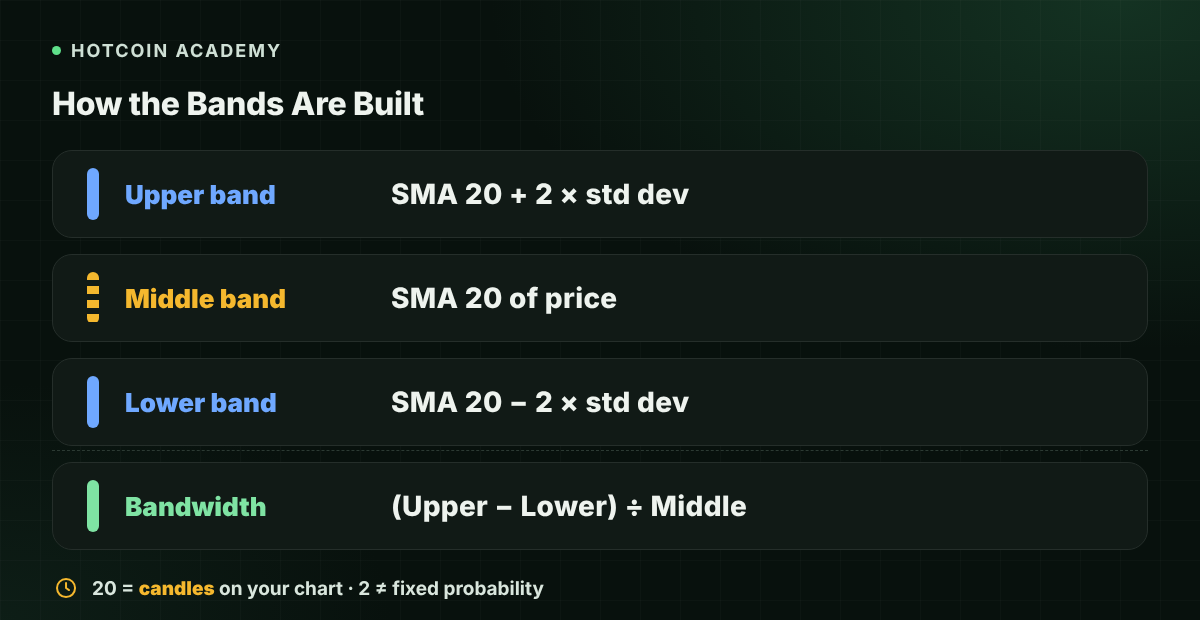
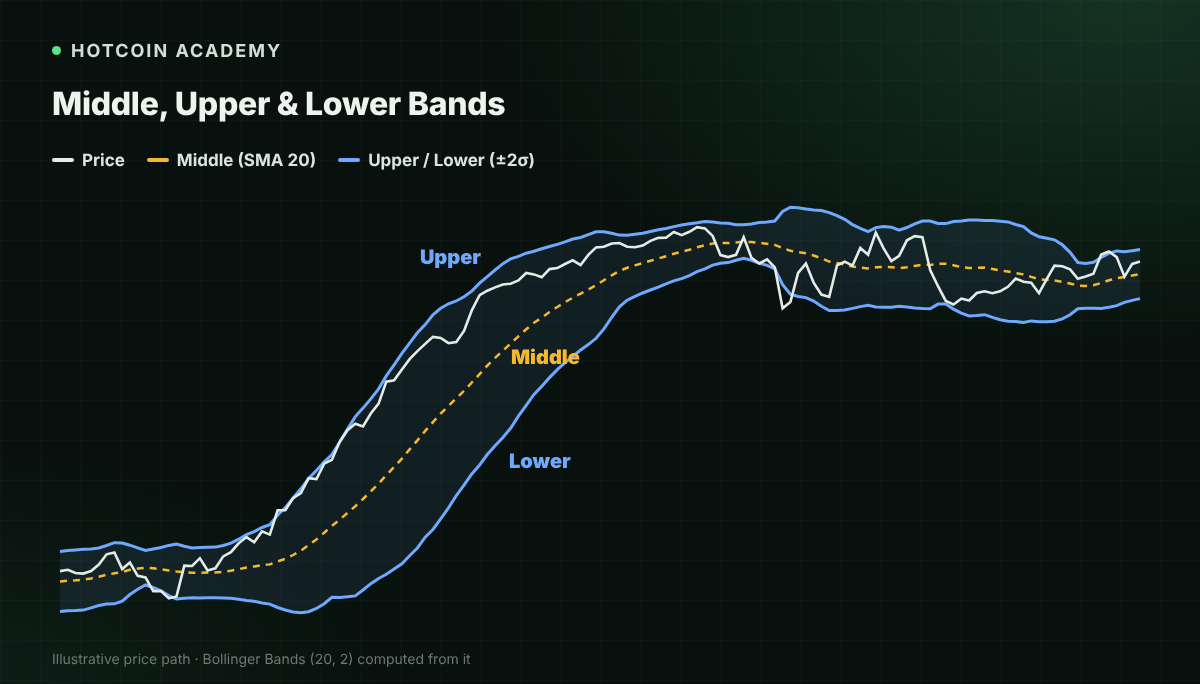
Bollinger Bands are a technical analysis tool introduced by John Bollinger. The common setup uses a simple moving average (SMA) of price as the middle band, then adds and subtracts a multiple of the standard deviation above and below it.
Standard deviation describes how dispersed prices are relative to the mean. When recent price volatility rises, the upper and lower bands usually expand; when volatility falls, they usually contract. It depicts the relative position and volatility state of price—not a trading range of fixed width.
| Component | Common calculation | What you can observe |
|---|---|---|
| Middle band | 20-period SMA | Recent average price |
| Upper band | Middle band + 2 × 20-period standard deviation | Relatively high price area |
| Lower band | Middle band − 2 × 20-period standard deviation | Relatively low price area |
Understanding the 20 and 2 Parameters
20 is the number of candles used to calculate the moving average and standard deviation. On an hourly chart, that is 20 hourly candles, not 20 days. 2 is the multiple of standard deviation separating the upper and lower bands from the middle band.
With a shorter period, the channel often adapts faster to new prices and is also more susceptible to short-term noise. A smaller standard deviation multiple makes the bands narrower and usually increases how often price touches them; a larger multiple does the opposite. Changing the moving average type or price source also changes the result, so check the settings before comparing screenshots.
"Two standard deviations" does not mean future price has a fixed probability of staying inside the channel. The return distribution, trends, and extreme volatility of crypto assets can all make simple normal-distribution intuition fail.
Reading Squeeze, Expansion, and Band Walk
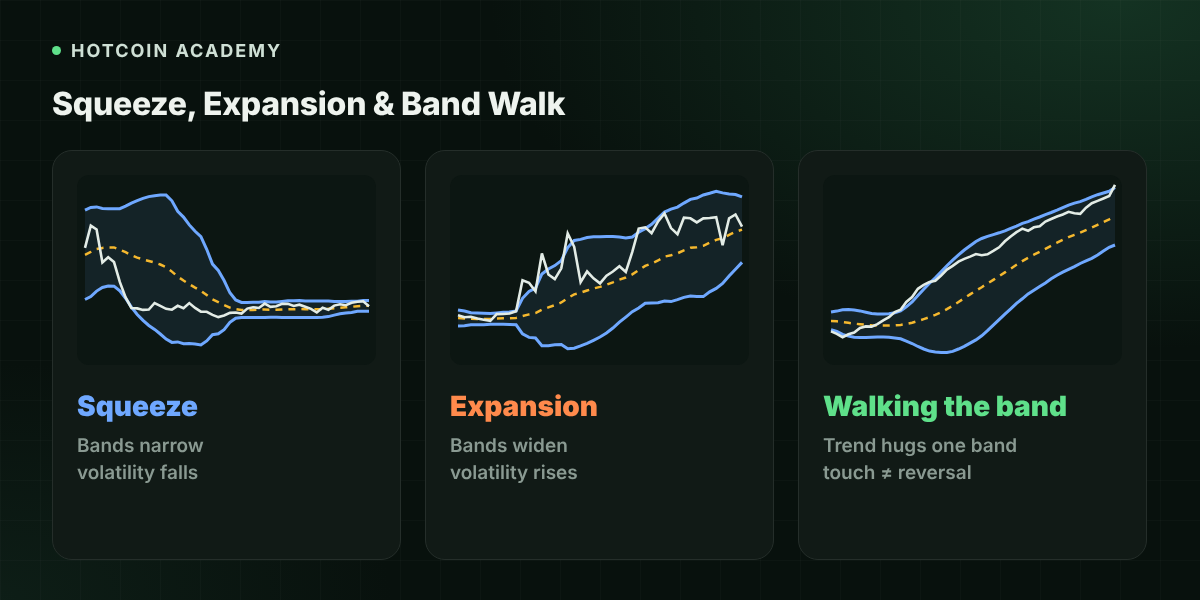
A squeeze is when the distance between the upper and lower bands shrinks, indicating lower volatility over the recent period. It may appear before a new round of volatility, but it cannot give the breakout direction, nor does it guarantee an immediate breakout.
An expansion is when the distance between the upper and lower bands widens, indicating volatility is increasing. An expansion may accompany a rally or a sharp drop—do not read it only as the market turning stronger.
A band walk is when price keeps hugging one side of the channel during a trend. In a strong uptrend, repeated touches of the upper band may reflect trend strength; in a sustained decline, the lower band does not necessarily provide effective support. Bollinger's usage rules explicitly remind that touching a band is not a trading signal.
| Market state | Common phenomenon | Risk to watch |
|---|---|---|
| Range-bound | Bands are relatively flat; price repeatedly returns to the middle | The range suddenly breaks |
| Uptrend | Middle band rises; price approaches the upper band repeatedly | Mistaking strength for an inevitable drop |
| Downtrend | Middle band falls; price approaches the lower band repeatedly | Repeatedly bottom-fishing into a decline |
| Low-volatility consolidation | Bands gradually narrow | Betting on the breakout direction too early |
How to Use Bollinger Bands
The following are analysis steps, not trading rules that guarantee profit. Suppose a coin consolidates between 90 and 100, and the bands gradually narrow:
- Mark the price range first. 90 and 100 come from price structure; you cannot replace them only with bands that move with price.
- Watch the close, not an intraday spike. Price briefly poking above the upper band and then returning into the range is different from closing above the range high.
- Check volume and follow-through. A breakout on volume may be more worth watching, but volume can also come from forced liquidations and does not guarantee continuation.
- Set invalidation conditions. If price returns to the old range after a breakout, reassess—do not stick to your original view just because "it already touched the upper band."
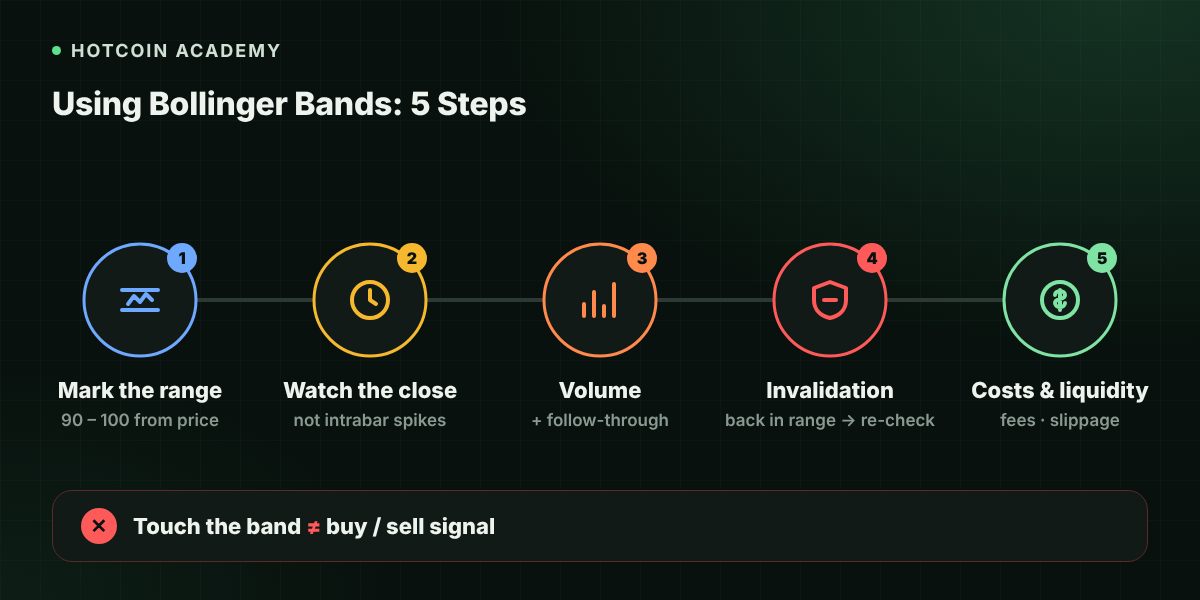
- Consider costs and liquidity. Small moves in a very narrow range may not cover fees and slippage.
If you want to quantify channel width, you can look at the bandwidth indicator: the common formula is (upper band − lower band) ÷ middle band, and some platforms multiply by 100 to show a percentage. Compare historical changes for the same coin and timeframe rather than arbitrarily applying one threshold across coins.
Common Mistakes
- "Sell when it touches the upper band, buy when it touches the lower band." This ignores band-walking trends and mistakes relative position for a reversal signal.
- "The longer the squeeze, the stronger the breakout must be." Duration does not guarantee the subsequent direction, magnitude, or profit potential.
- "Falling below the lower band means it is definitely undervalued." Bollinger Bands are based on price statistics and do not assess a project's fair value.
- "Adding more similar indicators makes it more reliable." Multiple price-derived indicators may simply repeat the same information.
FAQ
Q1: Are Bollinger Bands and "布林带" the same thing? They are usually different Chinese names for the same tool; always check the platform settings for the actual calculation.
Q2: What parameters should beginners use? You can start by learning the common 20 and 2 setting. It is a starting point for understanding the tool, not the optimal configuration for every market.
Q3: Do Bollinger Bands always rise after a squeeze? No. A squeeze means recent volatility has fallen; direction needs to be informed by subsequent price action.
Q4: Does a break above the upper band mean overbought? It only means price is relatively high within its recent distribution. Strong trends can persist, so you cannot conclude it will immediately pull back.
Q5: Can I combine it with MACD? You can observe volatility and momentum separately, but both derive from price. You still need to consider market structure, liquidity, and risk constraints.
Conclusion
Bollinger Bands are good at answering "is recent volatility expanding or contracting, and where is price in relative terms." Identifying the market state first and then interpreting band changes is more helpful than memorizing rules about touching the bands.
Risk warning: This article is for educational and informational purposes only and does not constitute investment advice. Illustrations do not represent real market conditions, and technical analysis cannot rule out false breakouts and extreme volatility.
Inirerekumendang pagbabasa
Tingnan ang higit pa