
SoFi (SOFI) Stock Price | Live Chart, Market Cap and FAQ
SOFI is the common stock ticker for SoFi Technologies, Inc. on Nasdaq. It is a listed company stock that provides digital financial services, not a token ticker. The company's app also offers crypto asset trading such as SoFi Crypto, but the ticker SOFI still refers to the company's common stock and does not represent any crypto asset within the app. The live chart and market cap on the page should be fed by the latest market data and will change with trading; do not treat a figure at one moment as a long-term constant conclusion.
To read this stock, first separate how much revenue Lending, Financial Services and Technology Platform each contribute, then return to the quote page to understand price and market cap.
Key Takeaways
- SOFI is the common stock ticker for SoFi Technologies, Inc. on Nasdaq. The company positions itself as a digital financial services platform where members can borrow, save, spend, invest and access related services in one app.
- The company primarily reports its business by Lending, Financial Services and Technology Platform.
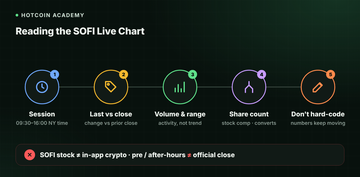
- The live chart reflects exchange trading, with regular trading hours from 9:30–16:00 New York time; pre-market and after-hours prices are not the official closing price.
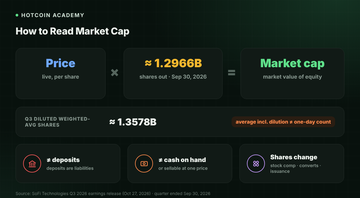
- Market cap is generally estimated as "share price × shares outstanding". It is not the cash or deposit balance on the company's books, nor does it mean all shares could be sold at the displayed price.
What is SoFi? Where is SOFI listed?
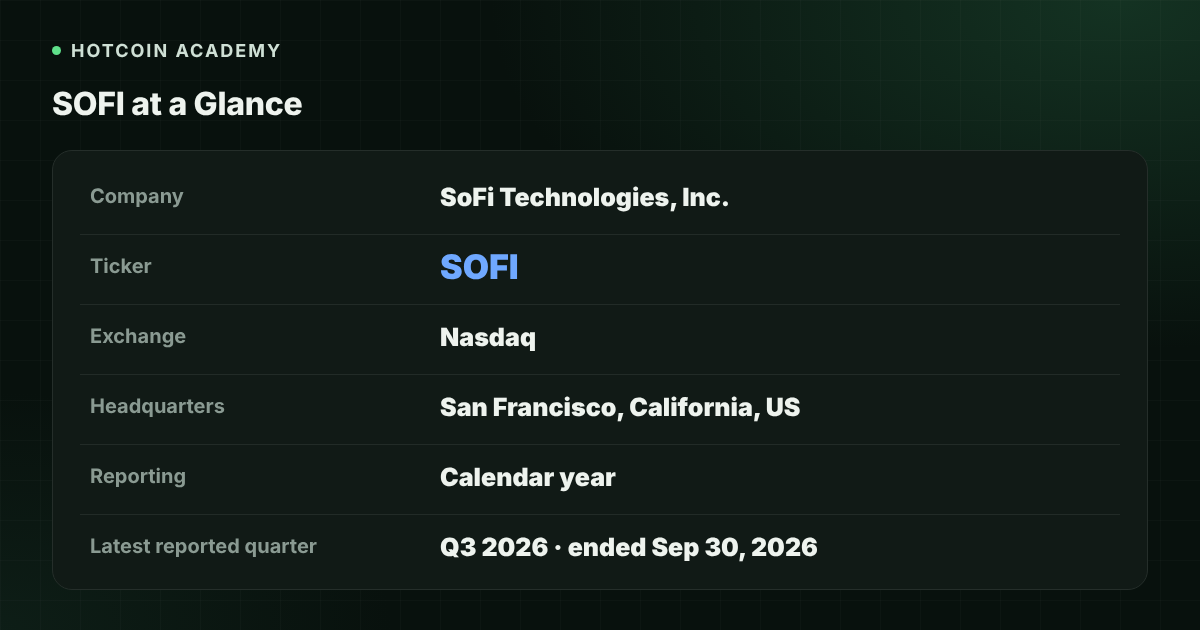
SoFi Technologies, Inc. is headquartered in San Francisco, USA, and is a member-centric digital financial services company that takes deposits and makes loans through SoFi Bank. The stock is listed on Nasdaq under the ticker SOFI. The company reports results on a calendar year basis.
| Item | Content |
|---|---|
| Company name | SoFi Technologies, Inc. |
| Ticker | SOFI |
| Exchange | Nasdaq |
| Headquarters | San Francisco, California, US |
| Reporting cycle | Calendar year |
| Latest reported quarter | Q3 2026, ended Sep 30, 2026 |
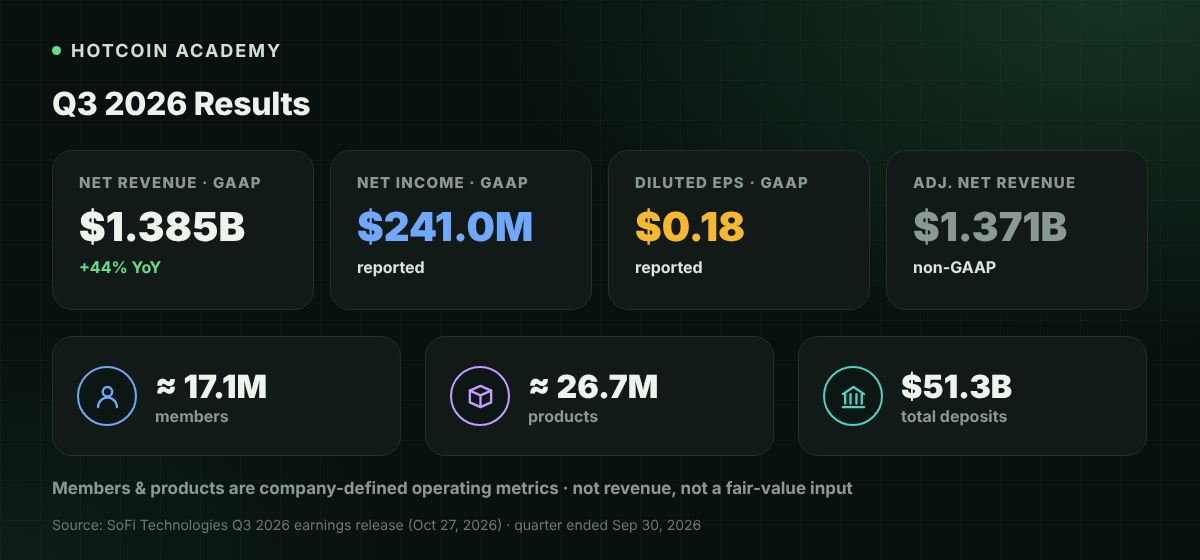
According to the third-quarter earnings release published on SoFi's investor relations website on Oct 27, 2026, GAAP net revenue for the quarter was $1.3851 billion, up 44% year over year; net income was $241.0 million, and diluted earnings per share were $0.18. The release also gives non-GAAP measures such as adjusted net revenue of $1.3711 billion and adjusted net income of $243.0 million. Non-GAAP figures help observe operating trends but cannot replace results reported under accounting standards. The figures above come from the company's published release and will be updated in later quarters; please refer to the latest filings.
As of the end of that quarter, SoFi reported approximately 17.1 million members and approximately 26.7 million products; total deposits were $51.325 billion. Member and product counts are company-defined operating metrics used to observe user scale and cross-use; they cannot be directly converted into revenue or a "fair share price".
What businesses does SoFi make money from now?
In Q3 2026, the company's net revenue by reportable segment was as follows:
| Segment | Quarterly net revenue (GAAP) | YoY | Quarterly note |
|---|---|---|---|
| Lending | $821.3 million | +66% | Adjusted net revenue $807.4 million; personal loans, student loans and home loans are the main products |
| Financial Services | $525.1 million | +25% | Includes SoFi Money, Relay, Invest, credit card, etc.; at quarter-end Financial Services products were about 23.2 million, within total products of about 26.7 million at period end |
| Technology Platform | $87.37 million | -24% | The YoY decline includes the impact of one large client exiting the platform before the end of 2025; the company says it grew 18% YoY excluding that impact |
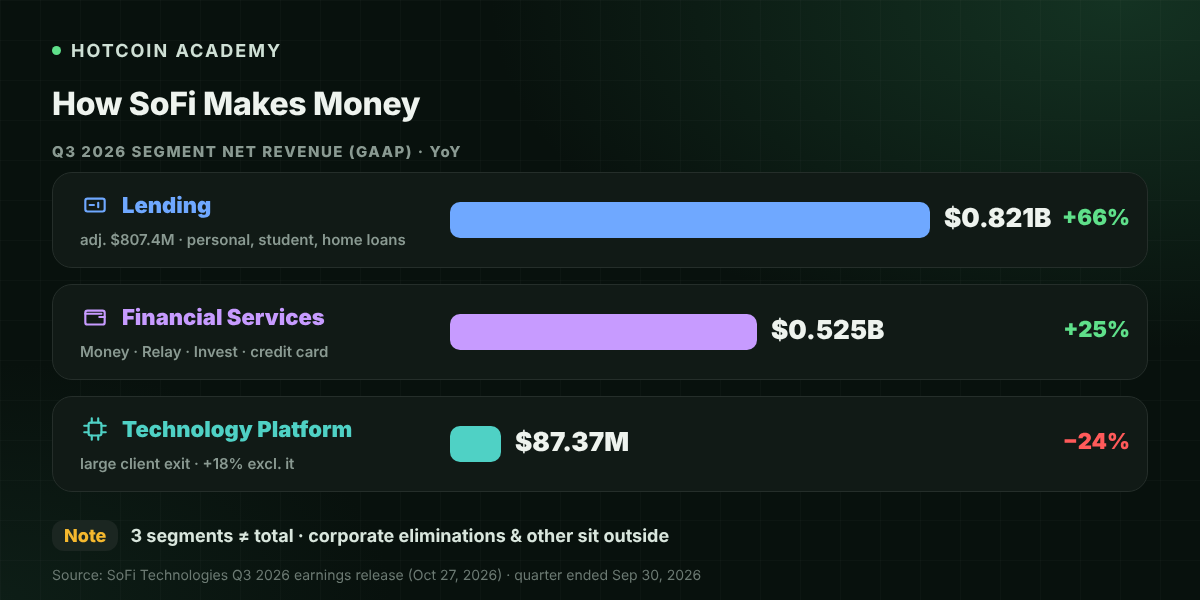
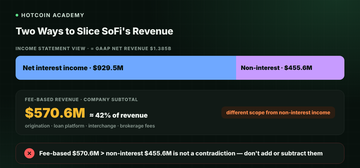
The consolidated statements also include corporate-level eliminations and other items, so simply adding the three segments does not equal consolidated net revenue. The same release also separates net interest income of $929.5 million and non-interest income of $455.6 million; it separately lists fee-based revenue at about $570.6 million, roughly 42% of total quarterly revenue. Fee-based revenue is a separately aggregated fee-type revenue (the release's examples include loan origination fees, loan platform, interchange fees and brokerage fees), which is not the same scope as non-interest income in the income statement; the former can be larger, and the two figures should not be directly added or subtracted or treated as contradictory. These breakdowns are for understanding revenue sources and cannot be directly used as a basis for buying or selling.
When reading SoFi's financial data, also distinguish loan originations, on-balance-sheet loan balances and recognized revenue. Loan originations in the quarter were $16.9 billion, of which about $3.8 billion came from the Loan Platform Business, which is volume originated or referred on behalf of third parties and does not equal amounts fully included in the company's profit.
How to read the SOFI live chart?
The "SOFI stock price" here refers to the trading price of SoFi Technologies' common stock on Nasdaq, not the net asset value of wealth products in the SoFi app, nor crypto assets traded in the app, and certainly not any token with the same name.
- Confirm the trading session first: US regular trading hours are 9:30 to 16:00 New York time. The corresponding Beijing time differs by 12 or 13 hours depending on daylight saving time; rely on the time zone marked on the page.
- Distinguish last price from closing price: The last price is the most recent trade. Change is usually calculated against the previous trading day's official close. Pre-market and after-hours liquidity is often poor, and such prices should not be treated as a confirmed closing result.
- Consider volume and the day's high and low: Intraday volatility may increase after interest rate, credit quality or earnings releases, but high single-day volume does not mean a trend is established.
- Watch for share count changes: Employee equity incentives, convertible bond conversion or share issuance all change the number of shares outstanding; check the basis when comparing long-term trends and per-share metrics.
- Rely on the page's real-time data: This article does not hard-code the stock price, change or market cap at any moment.
How to read market cap?
Market cap is generally estimated as follows:
Market cap ≈ current share price × shares outstanding
The share count basis is subject to the quote page's notes. As of Sep 30, 2026, SoFi's balance sheet listed approximately 1.2966 billion common shares issued and outstanding; the weighted average diluted shares used to calculate diluted EPS for the quarter were approximately 1.3578 billion. The latter is the period average and already considers potential dilution; it does not equal the shares outstanding at the close on any single day. Calculations should use the figures adopted by the page at the time.
When reading market cap, remember: it is not the cash on the company's books, nor total member deposits, and certainly not the amount you would get by selling all shares at once at the displayed price. Deposits are liabilities and are not the same thing as equity market cap.
Common misconceptions
- "SOFI is just a student loan company": Student loans are still one of the lending products, but the company now reports by Lending, Financial Services and Technology Platform, and deposits, investing and payments products also affect revenue.
- "Loan originations equal profit already booked": Originations reflect the loan volume facilitated in the period; revenue recognition also depends on interest, fees and accounting treatment, and some loans are sold or originated on behalf of third parties.
- "A high market cap means the company has a lot of cash or deposits": Market cap is an equity valuation; deposits sit on the liability side and cannot be directly added to or substituted for market cap.
FAQ
Q1: On which exchange is SOFI listed? SOFI is the common stock ticker for SoFi Technologies, Inc. on Nasdaq, referring to the stock of this digital financial services company, not a token.
Q2: What are SoFi's main business segments now? It primarily reports by Lending, Financial Services and Technology Platform. In Q3 2026, Lending GAAP net revenue was $821.3 million, Financial Services $525.1 million and Technology Platform $87.37 million, subject to the company's latest release.
Q3: How is SOFI's market cap calculated? Generally current share price multiplied by shares outstanding. The weighted average diluted shares in financial reports are used for EPS, and period-end shares issued may not equal the share count used on the quote page at a given moment; please refer to the page display.
Q4: Do pre-market or after-hours SOFI prices count as the official closing price? No. The official closing price usually corresponds to the result at the end of regular trading hours; extended-hours prices are a separate session of trades.
Q5: Can the share price alone tell whether SoFi is expensive? No. The share price does not include share count, net interest income, credit quality or capital adequacy, and cannot alone constitute a basis for buying or selling.
Conclusion
SOFI is the ticker for SoFi Technologies' stock listed on Nasdaq. To read this stock, first separate the revenue structure of Lending, Financial Services and Technology Platform, distinguish loan originations, on-balance-sheet balances and recognized revenue, then return to the quote page to read the live price and market cap; these figures change with the market and share count and should be based on the page's real-time display and the company's latest releases.
If you see US stock-related prices on a crypto platform or quote page, you also need to first distinguish whether you are looking at listed company stock quotes or trading products linked to the share price. You can start with What is the difference between Hotcoin TradFi and traditional brokers (Interactive Brokers, Tiger, Futu)? Fees, trading hours and threshold comparison.
Risk disclaimer: This article is for educational and informational purposes only and does not constitute any investment advice or buy/sell recommendation. The financial figures come from the company's published financial reports or earnings releases and may be updated by later filings. Results of financial services and credit companies are affected by interest rates, credit quality and the regulatory environment, and US stock prices are highly volatile and may cause partial or total loss of principal. Please refer to the company's latest releases and the real-time data on your page, and make prudent decisions based on your own risk tolerance.
Lectura recomendada
Ver más