Alphabet (GOOGL) Stock Price | Live Chart, Market Cap & FAQs
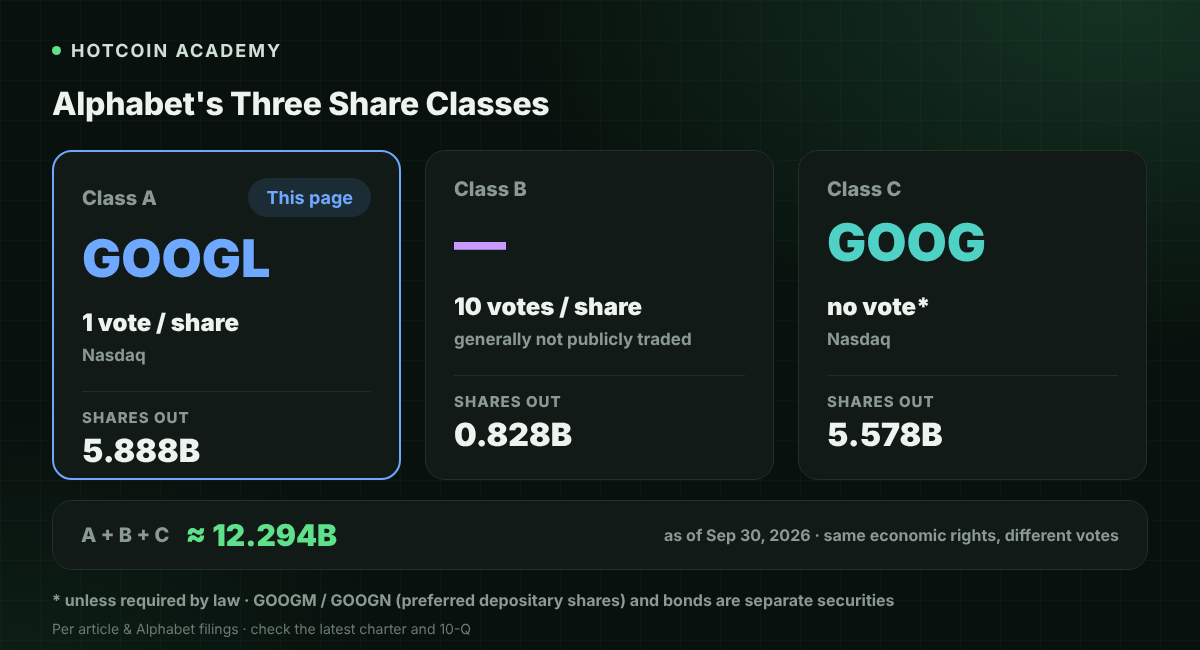
Alphabet also trades Class C capital stock on Nasdaq under the ticker GOOG. The two usually carry the same economic rights but differ in voting rights: GOOGL has one vote per share, while GOOG has no voting rights in principle. This article discusses GOOGL only; the live prices of the two may also differ slightly.
Key Takeaways
- GOOGL is Alphabet Inc.'s Class A common stock listed on Nasdaq; Google is its main business brand, not a separate listed ticker.
- The main difference between GOOGL and GOOG is voting rights: according to company securities filings, Class A common stock carries one vote per share, Class C capital stock has no voting rights in principle, and Class B common stock carries ten votes per share and is generally not publicly traded. This article focuses on GOOGL.
- The company's current reportable segments are Google Services, Google Cloud and Other Bets; refer to the latest financial report for exact definitions.
- Market cap is generally estimated as "share price × shares outstanding"; when calculating, confirm whether Class A, B and C shares are all included, and do not treat a single price on a page as the sole basis for all share capital.
What is Alphabet? What is the difference between GOOGL and GOOG?
Alphabet Inc. is headquartered in Mountain View, California, USA, and is the listed entity for Google Search, YouTube, cloud services and other businesses. Its Class A common stock is listed on Nasdaq under GOOGL; its Class C capital stock is also listed on Nasdaq under GOOG. The company reports on a calendar-year basis.
For the voting rights of different share classes, the latest charter and securities registration filings should prevail. According to Alphabet's prospectus and other filings submitted to the U.S. Securities and Exchange Commission: Class A common stock (GOOGL) carries one vote per share; Class B common stock carries ten votes per share and is generally held by insiders and not publicly traded on Nasdaq; Class C capital stock (GOOG) has no voting rights in principle unless otherwise required by applicable law. Class A, B and C shares are generally treated together for economic rights such as dividends, but market prices do not have to be identical at all times.
In its Q3 2026 earnings release, the company also listed other listed securities, including depositary receipts for mandatory convertible preferred stock (tickers GOOGM, GOOGN) and several corporate bonds. These securities are not the same stock as GOOGL, and this article does not cover them.
| Item | Details |
|---|---|
| Issuer | Alphabet Inc. |
| Stock discussed in this article | Class A common stock, ticker GOOGL |
| Related stock trading at the same time | Class C capital stock, ticker GOOG (no voting rights in principle) |
| Common stock generally not publicly traded | Class B common stock (ten votes per share, subject to the latest company filings) |
| Exchange | Nasdaq |
| Headquarters | Mountain View, California, USA |
| Reporting cycle | Calendar year |
| Latest reported quarter | Q3 2026, ended September 30, 2026 |
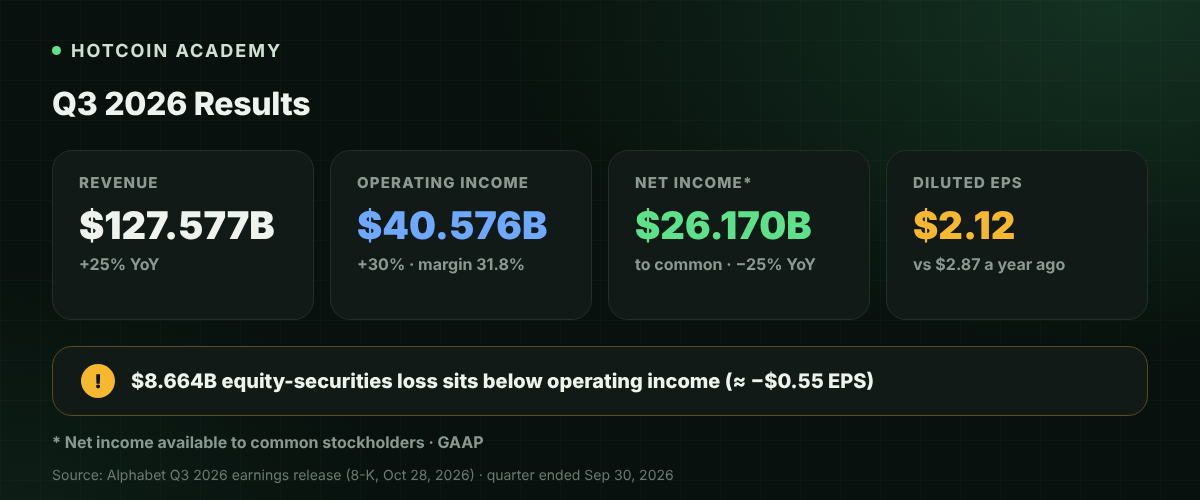
According to Alphabet's Q3 2026 earnings release published on October 28, 2026, consolidated revenue for the quarter was $127.577 billion, up 25% year over year; operating income was $40.576 billion, with an operating margin of 31.8%; net income attributable to common stockholders was $26.170 billion, and diluted EPS was $2.12. It is important to separate these items: other net expense for the quarter was $8.221 billion, including a net loss on equity securities of $8.664 billion, so net income and EPS were lower than the year-ago period; this should not be read as a synchronous decline in operating profit. The figures above come from the company's published release and will be updated in later quarters; please refer to the latest filings.
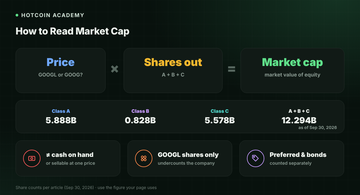
As of September 30, 2026, the company had approximately 12.294 billion shares outstanding, including 5.888 billion Class A shares, 828 million Class B shares and 5.578 billion Class C shares. Subsequent issuances, conversions or employee exercises will change these numbers.
What businesses does Alphabet make money from now?
In this earnings release, the company reports its business in three segments, with hedging gains and losses not allocated to segments:
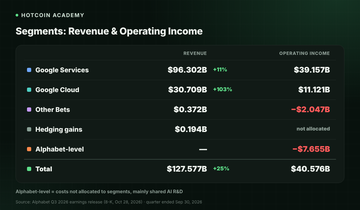
| Segment | Main components | Q3 2026 revenue | Operating income (loss) for the quarter |
|---|---|---|---|
| Google Services | Search, YouTube, advertising, Android, Chrome, Maps, Play, consumer devices and consumer subscriptions, etc. | $96.302 billion, up 11% year over year | $39.157 billion |
| Google Cloud | Enterprise-oriented infrastructure, platforms and applications, including Google Cloud Platform, Google Workspace, and product revenue such as TPU systems | $30.709 billion, up 103% year over year | $11.121 billion |
| Other Bets | Several operating segments that have not yet individually reached significant scale, with revenue mainly from autonomous driving mobility and internet services, etc. | $372 million | Operating loss of $2.047 billion |
| Revenue-related hedging, not allocated to the above segments | — | Gain of $194 million | — |
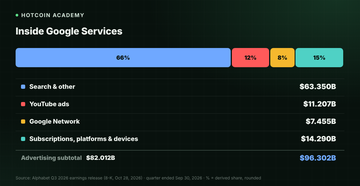
The same release also breaks down Google Services further: Google Search & other $63.350 billion, YouTube ads $11.207 billion, Google Network $7.455 billion, total advertising $82.012 billion; subscriptions, platforms and devices $14.290 billion. Some costs are not allocated to segments but recorded at the Alphabet level. The same release lists this unallocated cost at $7.655 billion and says it mainly reflects shared AI research and development spending. The sum of the three segments' operating income (loss), less this cost, equals consolidated operating income of $40.576 billion. Google Cloud revenue was $30.709 billion, up 103% year over year; the release mainly attributes this to demand for Google Cloud Platform in enterprise AI infrastructure, enterprise AI solutions and core cloud services, and states that TPU system sales also contributed notably to growth. These breakdowns are for understanding the revenue structure and cannot be directly converted into a "fair share price."
How to read GOOGL's live chart?
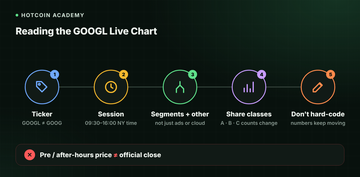
The "live chart" on a quote page generally comes from securities market trade data. When reading it, you can follow these steps:
- Confirm the ticker first: "Google stock price" in this article and in most Chinese-language searches corresponds to GOOGL. If the page shows GOOG, that is the same company's Class C capital stock; the price may be close but is not necessarily identical.
- Then confirm the time period: regular U.S. stock market hours are 9:30 to 16:00 New York time. Percentage changes are usually calculated relative to the previous trading day's official close. Pre-market and after-hours trading is often thinner and should not be treated as a confirmed closing result.
- Compare with the segment structure of the latest reported quarter: first look at revenue and operating income for Google Services, Google Cloud and Other Bets, then check whether other income and expenses fluctuated sharply, to avoid explaining the stock price with only one of advertising or cloud.
- Note share classes: buybacks, employee exercises, public offerings or preferred stock conversions can all change the number of shares of each class. When comparing long-term trends, confirm whether the page uses adjusted prices.
- Do not hard-code a number from a single moment: stock prices change at any time; this section only explains how to read them. For specific numbers, see the live display on the page.
How to read market cap?
Market capitalization is generally estimated as follows:
Market cap ≈ current share price × shares outstanding
For Alphabet, the key is which classes the "share count" includes. A common approach is to include all Class A, B and C shares, then multiply by a reference price (some pages use GOOGL, others use GOOG). Because the prices of the two publicly traded classes may differ slightly, and because of whether diluted shares are included, market caps calculated by different websites may not be exactly the same.
There are three common boundaries when reading market cap:
- Market cap is not the cash on the company's books, nor is it equal to the amount that would be received if all shares were sold at once at the displayed price.
- Multiplying only GOOGL's outstanding shares while omitting GOOG and Class B shares would significantly understate the company's overall equity scale.
- Preferred stock or other listed securities are usually calculated separately and should not be mixed with common stock/Class C capital stock as the market cap of the same stock.
Common misconceptions
- "GOOGL's issuer is still Google Inc.": The current listed entity is Alphabet Inc.; Google is its main business brand and segment source.
- "GOOGL and GOOG are exactly the same stock and can be substituted freely": Both correspond to Alphabet's economic rights, but voting rights differ, and intraday prices may show small differences. This article focuses on GOOGL.
- "A decline in net income means advertising or cloud must be losing money": Operating income in Q3 2026 actually grew; the quarter's EPS was lower than the year-ago period, mainly due to fair value changes in equity securities within other income and expenses, and this should not be directly interpreted as a turn to losses in the core business.
FAQs
Q1: Is GOOGL Google's stock? Who is the issuer? GOOGL is Alphabet Inc.'s Class A common stock listed on Nasdaq. Google is Alphabet's main business brand; results from Search, YouTube and cloud services are also mainly reflected in Alphabet's financial reports, but the listed entity's name is Alphabet Inc.
Q2: What is the difference between GOOGL and GOOG? According to company securities filings, GOOGL is Class A common stock with one vote per share; GOOG is Class C capital stock with no voting rights in principle unless otherwise required by law. The company also has Class B common stock with ten votes per share that is generally not publicly traded. The two publicly traded stocks usually have the same economic rights, but their prices do not have to be identical. This article focuses on GOOGL, and specific rights are subject to the latest company filings.
Q3: What business segments does Alphabet have now? According to the Q3 2026 earnings release, the company reports its business in three segments: Google Services, Google Cloud and Other Bets. In the quarter, Google Services revenue was $96.302 billion, Google Cloud revenue was $30.709 billion, and Other Bets revenue was $372 million. Specific product definitions are subject to the company's latest financial report.
Q4: How is GOOGL's market cap calculated? It is generally calculated by multiplying the current share price by shares outstanding. For Alphabet, it is usually necessary to confirm whether all Class A, B and C shares are included and which reference price the page uses. Market cap is not company cash and should be based on the quote page display.
Q5: Can I tell whether GOOGL is expensive just by looking at its stock price? No. A stock price alone does not consider share classes, earnings, growth and valuation levels. Even with market cap, you still need to compare financial data and risks; the current price cannot be treated as a conclusion that it is "cheap" or "expensive."
Conclusion
GOOGL is Alphabet Inc.'s Class A common stock listed on Nasdaq; its main difference from GOOG is voting rights, and this article focuses on GOOGL. When looking at this stock, first confirm the issuer and the current three business segments, then check the revenue and profit structure of the latest reported quarter, and return to the quote page to read the live price, percentage change and market cap; these numbers change with the market and should be based on the page's live display and the company's latest announcements.
If you also want to distinguish what "price" and "market cap" each explain and do not explain, you can first read What are market cap, circulating supply and fully diluted valuation (FDV)?.
Risk warning: This article is for educational and informational purposes only and does not constitute any investment advice or buy/sell recommendation. The financial figures in this article come from the company's published financial reports or earnings releases and may be updated by subsequent filings. U.S. stock prices are highly volatile, and advertising, cloud services and AI-related businesses may also be affected by competition, regulation, capital expenditures and fluctuations in other income and expenses, which may cause partial or total loss of principal. Please refer to the company's latest announcements and the real-time data on your page, and make decisions carefully based on your own risk tolerance.
Lectura recomendada
Ver más