DCA Backtest Calculator: Historical Returns of a DCA Strategy
A DCA backtest calculator uses historical price data to simulate the cumulative return, annualized return and maximum drawdown of a dollar-cost averaging (DCA) strategy, so you can judge how a long-term plan would have performed.
Dollar-cost averaging (DCA) is a common approach for long-term crypto investors: you invest a fixed amount on a fixed schedule, which smooths your entry price. A DCA backtest calculator puts that idea against real historical data and shows how the strategy behaved across different periods. The guide below covers how to use these tools efficiently in practice.
What can a DCA backtest calculator measure?
Most backtesting tools support the following core outputs:
Total invested and final value: the total amount you put in and the value of the position at the current (or end) date.
Total return and return rate: absolute profit and the percentage gain.
Annualized return: makes comparison with other investments easier.
Maximum drawdown: the largest unrealized loss during the strategy period.
Average buy price: the holding cost after DCA smoothing.
Adjustable parameters: custom contribution frequency (weekly or monthly), amount, start and end dates, and asset (BTC, ETH and others).
Some tools also plot a return curve so you can see how the position grew over time.
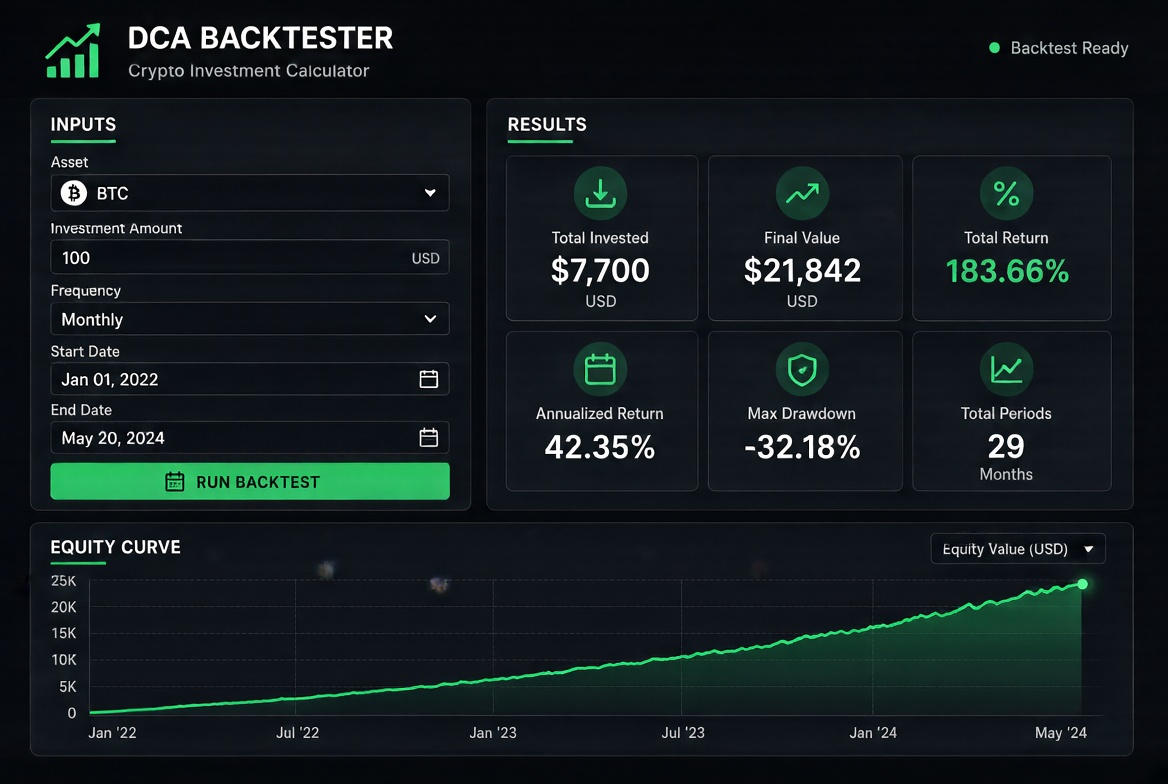
How to use a DCA backtest calculator (step by step)
Open a tool that supports DCA backtesting (offered by some exchanges, professional crypto data sites and standalone calculators).
Pick the asset, such as BTC or ETH.
Set the contribution amount and frequency (daily, weekly or monthly).
Choose the backtest start and end dates (covering a full bull and bear cycle is best).
Run the calculation and review total invested, final value, total return, annualized return and maximum drawdown.
Change the parameters and compare several runs, for example different frequencies or different date ranges.
Read the results together with the return curve to see how the asset behaved in bull and bear markets.
The process is straightforward and far faster than gathering historical prices by hand — a practical gain that few top-ranking pages explain systematically.
How to read backtest results correctly
Total and annualized return: they show overall performance, but remember that history does not repeat itself.
Maximum drawdown: this is the key risk metric. The deeper the drawdown, the greater the psychological pressure and the chance of giving up.
Average cost: the core advantage of DCA is buying through bear markets, which lowers the overall holding cost.
Effect of time period: different start and end dates produce clearly different results, so test several ranges.
Common failure points and caveats:
A backtest rests on historical data and cannot predict future prices.
Most tools ignore trading fees, slippage and withdrawal costs, so real returns are slightly lower.
Opportunity cost and tax effects are not included.
In extreme markets or long one-way declines, DCA can still leave you underwater for a long stretch.
Use cases and risk warning
Strategy validation: test how DCA performed in different market environments with historical data.
Parameter tuning: compare weekly versus monthly contributions and different contribution amounts.
Long-term planning: help investors form reasonable expectations about volatility.
Risk warning: historical backtest results are no guarantee of future returns and are not investment advice. The crypto market is highly volatile; DCA smooths your cost basis but can still mean a long loss period. Decide how much to invest based on your own risk tolerance and stay disciplined over the long term.
FAQ
**Q1: How is the annualized return in a DCA backtest usually calculated?**A: It normally uses a compound annualized return formula, converting the total return into an average yearly growth rate for easier comparison across periods.
**Q2: Why do BTC DCA backtests differ so much from one period to another?**A: Different start and end dates cover different bull and bear phases. A full-cycle backtest is more informative.
**Q3: Do backtest results include fees?**A: Most basic tools ignore fees, so actual execution returns are slightly lower. Some advanced tools let you set your own fee rate.
**Q4: Is DCA guaranteed to be profitable?**A: No. If the asset falls over the long run, or you start near a peak and stop too early, you can still lose money. DCA reduces timing risk, not market risk.
**Q5: What should beginners focus on when using a DCA backtest calculator?**A: Look at maximum drawdown and the shape of the return curve first, and the final return rate second. Understanding how the strategy performs in its worst phase helps you stick with it.
Lectura recomendada
Ver más