
US Stock Market Report
Hotcoin TradFi Daily Asset Report|October 19, 2026
.PNG)
Author kim
U.S. technology stocks came under notable pressure last Friday, with the Nasdaq falling more than the Dow Jones and the VIX rising in tandem. The rolling 24-hour volatility of Hotcoin TradFi spot products was concentrated in leveraged ETFs focused on South Korea and semiconductors; the derivatives side also showed a similar high-volatility structure. The key points to watch today are whether the sell-off in technology stocks continues, and whether housing market data and a new round of earnings reports can change risk appetite.
Market Sentiment: Volatility Expectations Rise as Technology Stocks Come Under Pressure
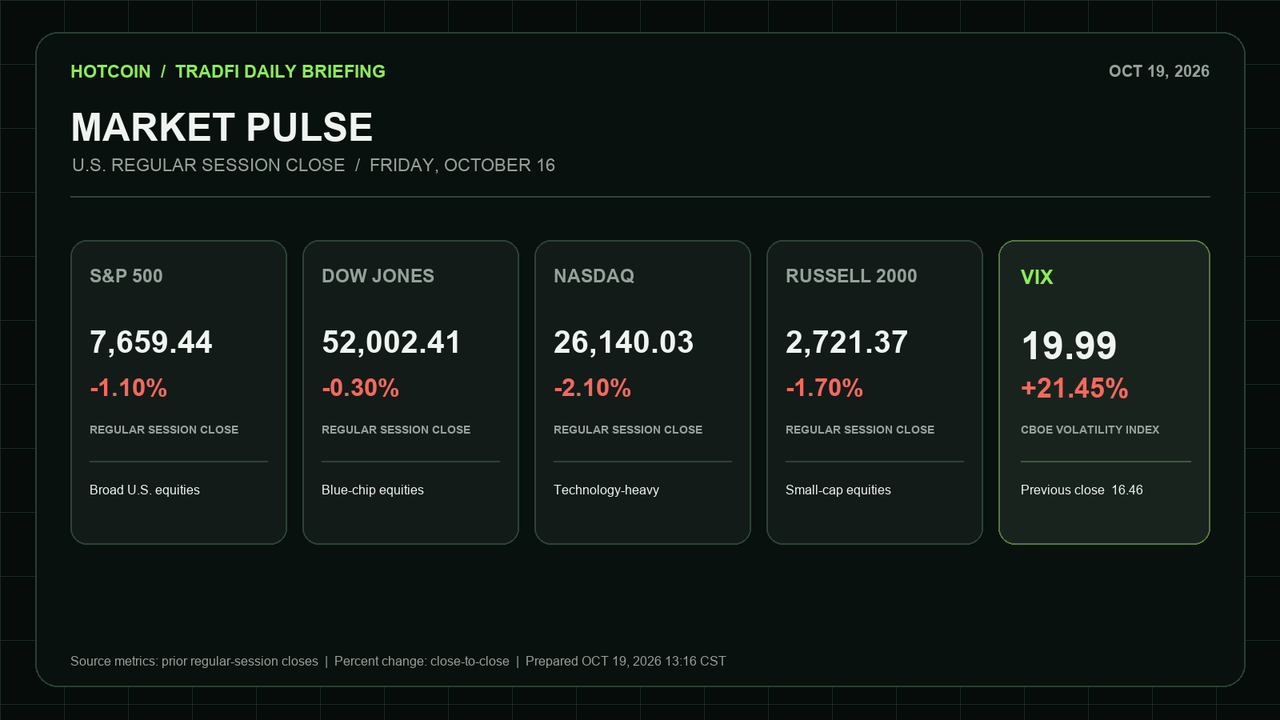
At the close of U.S. trading on October 16, the S&P 500 stood at 7,659.44, down 1.1%; the Dow Jones Industrial Average stood at 52,002.41, down 0.3%; the Nasdaq Composite stood at 26,140.03, down 2.1%; and the Russell 2000 stood at 2,721.37, down 1.7%. The Nasdaq’s decline was significantly larger than the Dow’s, indicating that the day’s pressure was concentrated mainly in large-cap technology and growth sectors rather than reflecting a synchronized decline across all sectors.
The VIX closed at 19.99, compared with 16.46 in the previous trading session, an increase of 21.45%. This indicates that the market’s pricing of near-term volatility rose notably, but a one-day increase in the VIX alone does not mean that the market has entered a sustained panic phase.
Chip stocks continued to weaken that day: Micron fell 5.6%, Intel fell 5.8%, AMD fell 6.0%, and Broadcom fell 4.5%. One of the market’s discussion points was whether investment in AI infrastructure can continue to translate into revenue and profits; this is the current market narrative and focus, and should not be interpreted as a confirmed single cause.
Hotcoin TradFi Spot Assets: Key Volatility Watch
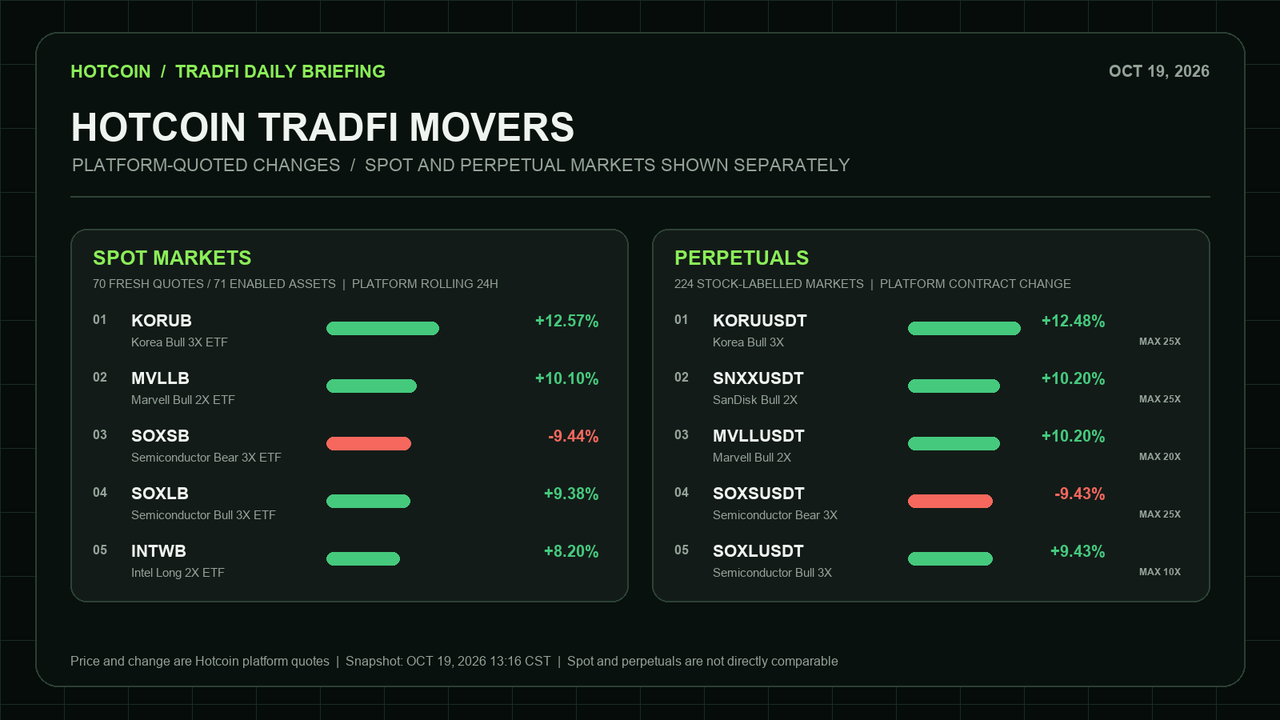
The table below is ranked by the absolute value of the rolling 24-hour percentage change on the Hotcoin platform, with prices denominated in USDT. The platform’s currently enabled list contains 71 U.S. stock/ETF-category assets. Of these, 70 had quote update times within five minutes before this data collection, while the quote for one asset had not been updated for more than 24 hours. Therefore, the following is a key volatility watch based on valid quoted samples and is not described as the complete platform-wide Top 5.
|
Platform Code
|
Asset
|
Latest Price (USDT)
|
Platform Rolling 24-Hour Change
|
|---|---|---|---|
|
KORUB
|
South Korea 3x Long ETF
|
11.82
|
+12.57%
|
|
MVLLB
|
Marvell 2x Long ETF
|
27.67
|
+10.10%
|
|
SOXSB
|
Semiconductor Index 3x Short ETF
|
45.56
|
-9.44%
|
|
SOXLB
|
Semiconductor 3x Long ETF
|
100.93
|
+9.38%
|
|
INTWB
|
Intel 2x Long ETF
|
18.19
|
+8.20%
|
The defining feature of this spot-market volatility ranking is not a single company leading the gains, but the presence of leveraged thematic products near the top. Significant volatility appeared in both long and short semiconductor products, indicating that short-term sector price movements were amplified by leveraged instruments; the South Korea 3x long product also shows that volatility was not concentrated solely in U.S. technology stocks. For such instruments, a single day’s directional performance cannot be directly extrapolated into long-term returns.
Hotcoin TradFi Futures: Separate Observation, Not Ranked Together with Spot Products
Futures market data uses the Hotcoin perpetual futures market’s own percentage-change indicator and is calculated separately from the spot products above. Listed below are the U.S. stock/ETF-related futures contracts with the highest volatility, along with the platform’s latest prices; futures price changes are not equivalent to the official closing changes of the underlying stocks.
|
Contract Code
|
Latest Price (USDT)
|
Platform Contract Change
|
Maximum Leverage
|
|---|---|---|---|
|
KORUUSDT
|
11.81
|
+12.48%
|
25x
|
|
SNXXUSDT
|
9.62
|
+10.20%
|
25x
|
|
MVLLUSDT
|
27.68
|
+10.20%
|
20x
|
|
SOXSUSDT
|
45.59
|
-9.43%
|
25x
|
|
SOXLUSDT
|
100.96
|
+9.43%
|
10x
|
The Korea and semiconductor themes are highly overlapping among spot products and the contracts rankings, but the two types of products differ in price, trading mechanisms, and risk structures. Contracts are also affected by leverage, margin, and funding rates, so one cannot assume that returns on both sides will be exactly the same based solely on assets with the same name.
Today’s U.S. Stock Market Calendar: Housing Market Data and Earnings Season Continue
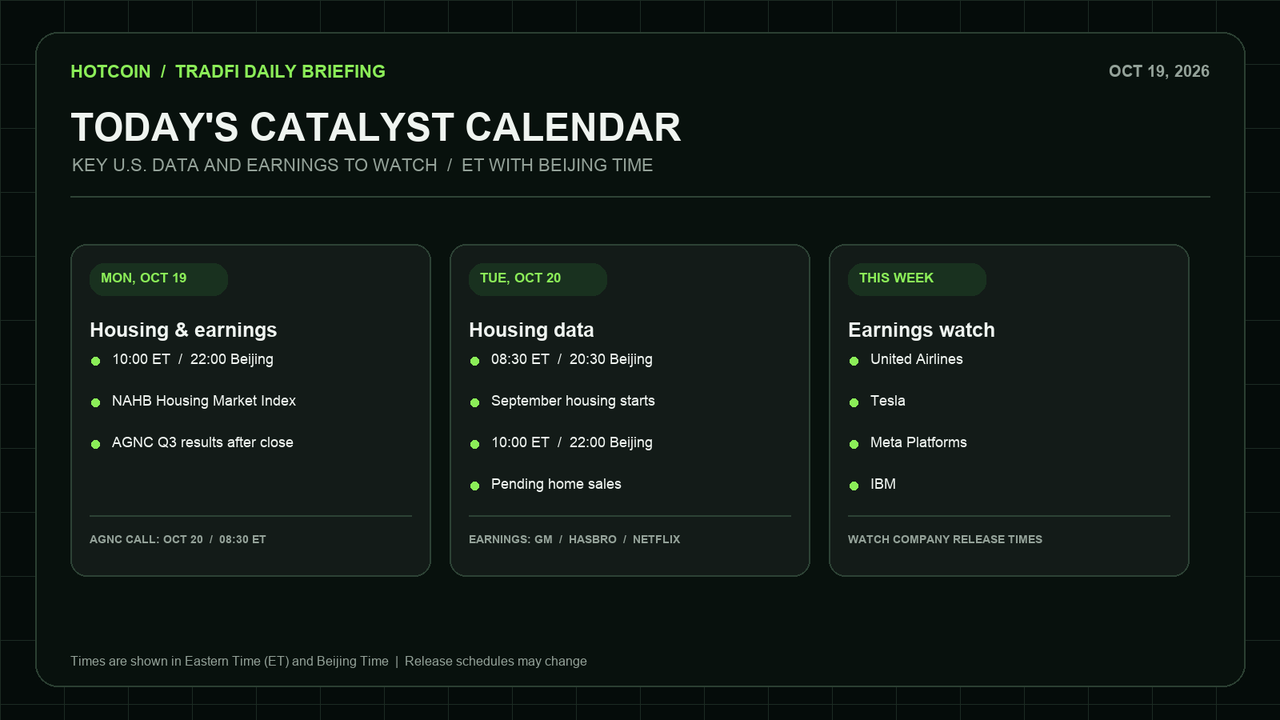
At 10:00 a.m. Eastern Time on Monday, October 19, the October NAHB/Wells Fargo Housing Market Index will be released; this corresponds to 10:00 p.m. Beijing Time on October 19. The survey reflects homebuilders’ views on current sales, expectations for new-home sales, and prospective buyer traffic, and can serve as a window into housing demand in a high-interest-rate environment.
After the U.S. market closes on Monday, AGNC Investment will release its third-quarter results; the company has scheduled a conference call for 8:30 a.m. Eastern Time on October 20 (8:30 p.m. Beijing Time on October 20). This week, investors should also watch Tuesday’s U.S. September housing starts and pending home sales data, as well as earnings updates from companies including GM, Hasbro, and Netflix. Exact release times are subject to each company’s schedule.
The Federal Reserve has entered the blackout period ahead of the next FOMC meeting, with fewer public remarks from policymakers. Market attention is therefore more likely to shift toward economic data, corporate guidance, and changes in interest-rate expectations.
Key Focus Points for Today
-
Watch whether the sell-off in technology stocks spreads from chips to a broader range of growth stocks, as well as changes in the Nasdaq’s relative strength versus the Dow Jones.
-
Observe whether the VIX remains elevated; if volatility expectations decline, trading volume and market breadth should be considered together to confirm whether risk appetite has genuinely recovered.
-
Track the NAHB Housing Market Index and this week’s housing data to assess how interest-rate-sensitive sectors respond to demand and financing costs.
-
The leading volatile products on the Hotcoin platform are primarily leveraged and inverse ETF themes. When reading their gains and losses, identify the product direction and leverage multiple at the same time, and do not equate an ETF’s one-day move with the performance of its underlying companies.


 hotcoin.com