
Nike (NKE) Stock Price | Live Chart, Market Cap & FAQ
NKE is the ticker for NIKE, Inc.'s common stock listed on the New York Stock Exchange. The live chart and market cap on the page should be connected to the latest market data by the system and will change with trading activity; it is not advisable to treat a moment's figures as a long-term conclusion.
When reading this stock, first look at which regions and channels the company makes money from, then return to the quote page to understand the meaning of price, change, and market cap.
Key Takeaways
- NKE is the ticker for NIKE, Inc.'s common stock listed on the New York Stock Exchange. The company's business is mainly Nike brand athletic footwear and apparel, and it owns the wholly-owned subsidiary Converse.
- The company reports revenue by regions including North America, Europe, Middle East & Africa, Greater China, and Asia Pacific & Latin America, and also discloses Wholesale and Nike Direct channels.
- The live chart reflects exchange trading. Regular trading hours are 9:30–16:00 New York time; pre-market and after-hours prices are not equal to the official closing price.
- Market cap is generally estimated as "share price × shares outstanding". It is not the cash on the company's books, nor does it mean all shares could be sold at the displayed price.
What is Nike? Where is NKE listed?
NIKE, Inc. is headquartered near Beaverton, Oregon, USA, and is a company that designs, markets, and distributes athletic footwear, apparel, equipment, and accessories. The stock is listed on the New York Stock Exchange under the ticker NKE. The company's fiscal year typically ends on May 31, so the first quarter corresponds to June through August.
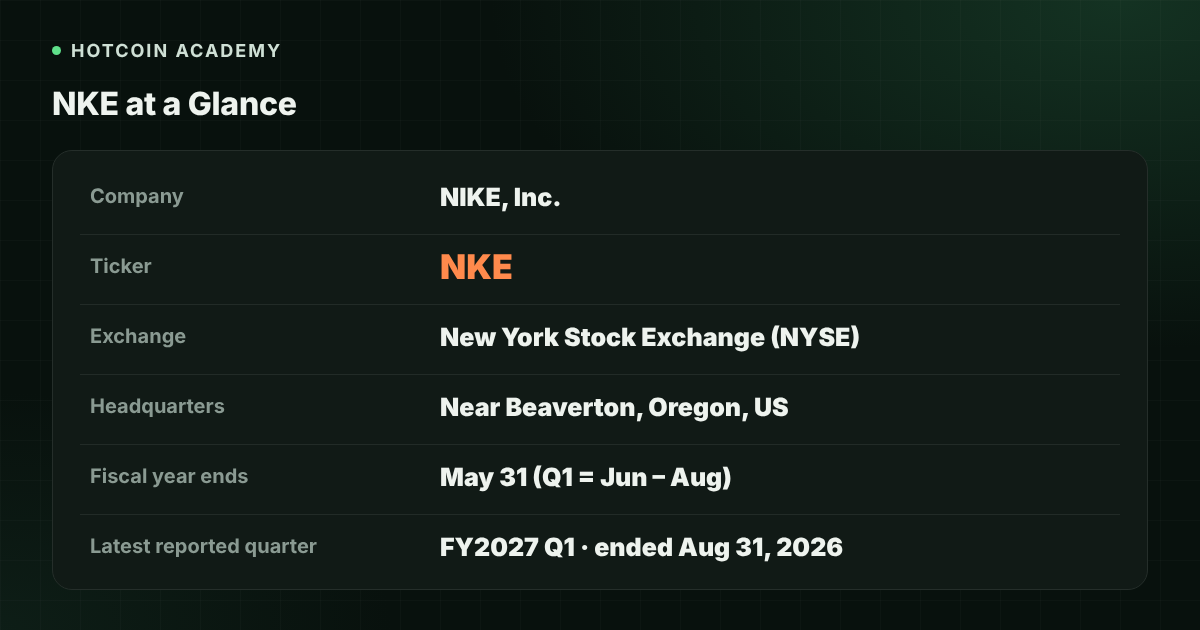
| Item | Content |
|---|---|
| Company name | NIKE, Inc. |
| Ticker | NKE |
| Exchange | New York Stock Exchange (NYSE) |
| Headquarters | Near Beaverton, Oregon, US |
| Fiscal year ends | Typically May 31 |
| Latest reported quarter | FY2027 Q1, ended August 31, 2026 |
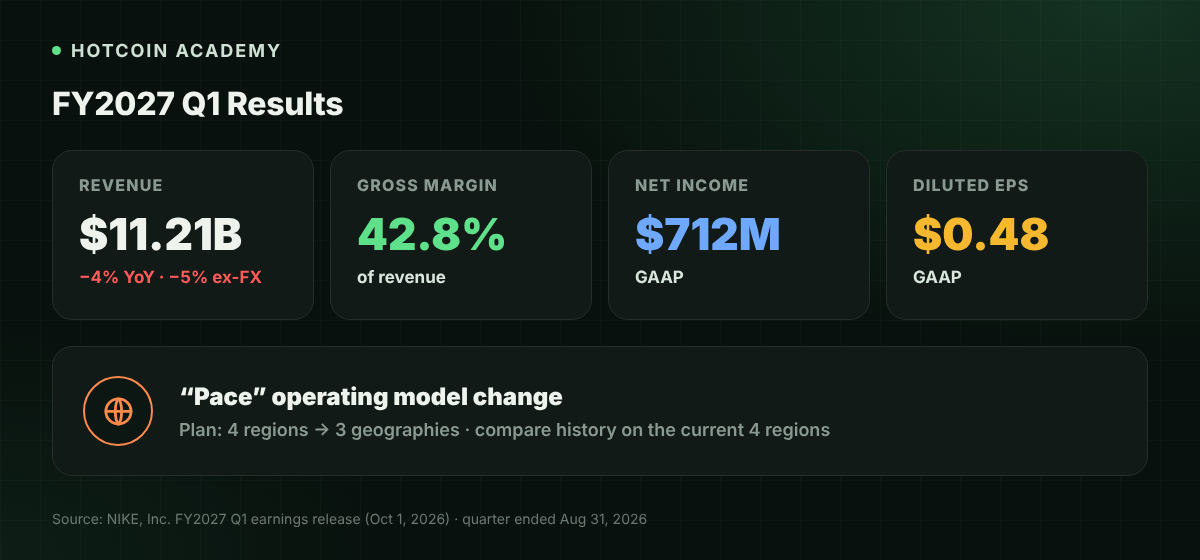
According to the FY2027 Q1 earnings release published on NIKE's investor relations website on October 1, 2026, revenue for the quarter was $11.213 billion, down 4% year-over-year on a reported basis and down 5% on a currency-neutral basis; gross margin was 42.8%; net income was $712 million, and diluted earnings per share were $0.48. These figures come from the company's published release and will be updated in subsequent quarters; please refer to the latest filings.
How to read Nike's revenue structure?
Nike's revenue can be read by brand, region, and channel at the same time. The main composition for FY2027 Q1 is as follows:
| Basis | Quarterly revenue | YoY (reported) |
|---|---|---|
| Nike Brand | $10.952 billion | Down 4% |
| Of which: North America | $5.127 billion | Up 2% |
| Of which: Europe, Middle East & Africa (EMEA) | $3.176 billion | Down 5% |
| Of which: Greater China | $1.180 billion | Down 22% |
| Of which: Asia Pacific & Latin America | $1.463 billion | Down 2% |
| Converse | $263 million | Down 28% |
| NIKE, Inc. total | $11.213 billion | Down 4% |
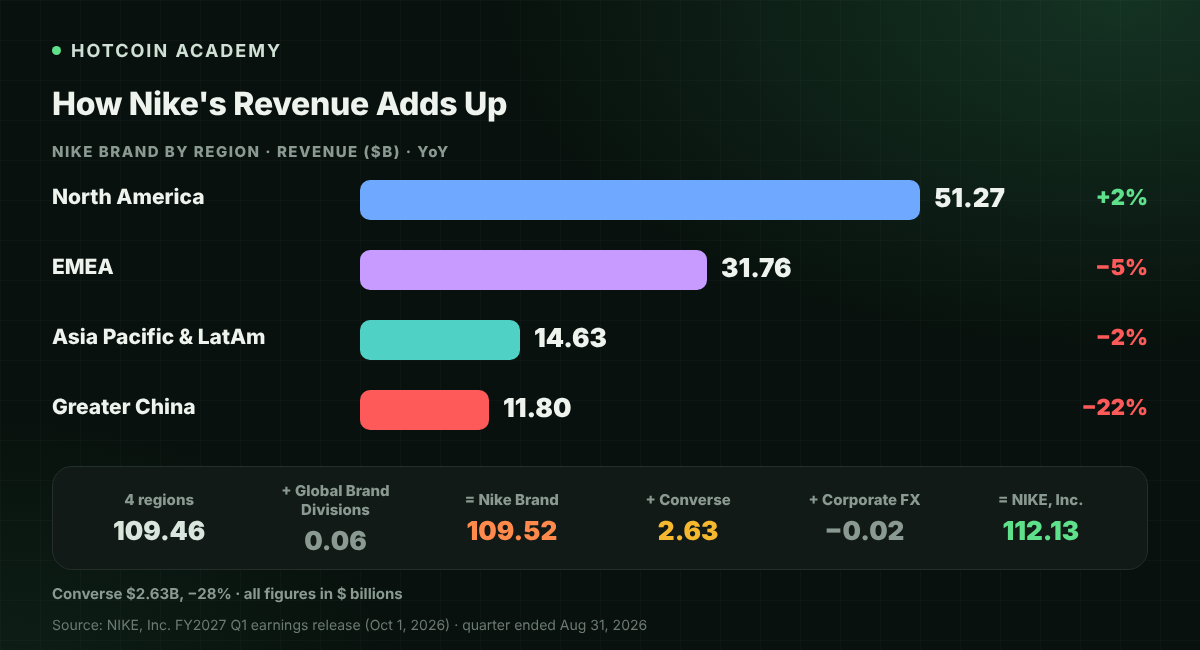
The four regions in the table add up to $10.946 billion, which is $6 million less than the Nike Brand total of $10.952 billion. The difference comes from Global Brand Divisions in the release (brand licensing and other miscellaneous revenue, not belonging to any geographic segment). Adding Converse's $263 million and the -$2 million at the corporate level arising from centrally managed foreign exchange risk gives the NIKE, Inc. total of $11.213 billion. It is not advisable to directly add the rough figure of "$11 billion" to the two-decimal regional or Converse figures.
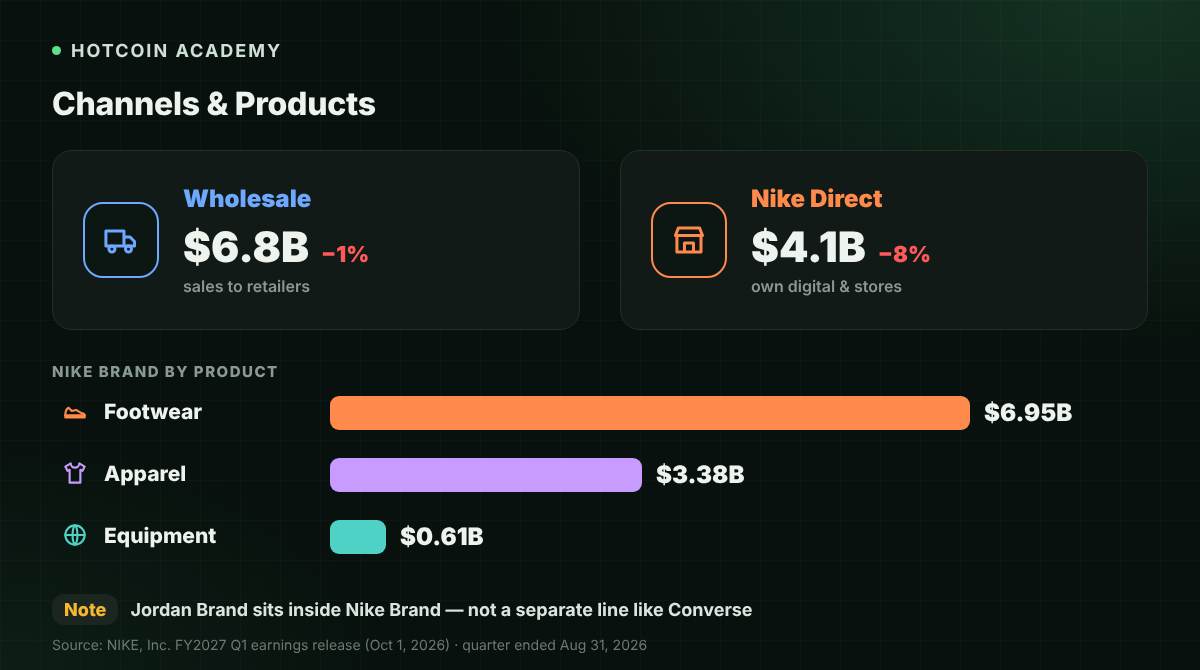
In the same quarter, Nike Brand Wholesale revenue was $6.8 billion, down 1% year-over-year; Nike Direct (owned e-commerce and owned stores) revenue was $4.1 billion, down 8% year-over-year. By product, Nike Brand footwear revenue was $6.951 billion, apparel $3.384 billion, and equipment $611 million. The Jordan Brand mentioned in the release belongs to the Nike Brand business and is not a separately presented line in the segment revenue table like Converse; the specific basis should still be the company's latest statements.
The company also mentioned in the release that it will advance an operating model change called Pace and plans to reorganize its regional structure into three geographic regions. Before the new basis is fully reflected in published statements, historical comparisons should still be based on the four regions mentioned above.
How to read NKE's live chart?
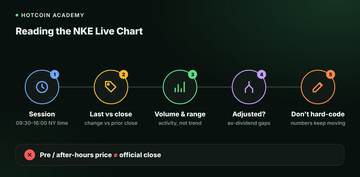
The live chart on the quote page comes from securities market trading. It is recommended to read it in the following steps:
- Confirm the trading session first: US regular trading hours are 9:30 to 16:00 New York time. The corresponding Beijing time differs by 12 or 13 hours depending on daylight saving time; refer to the time zone marked on the page.
- Distinguish the latest price from the closing price: The latest price is the most recent trade price. The change is usually calculated relative to the previous trading day's official closing price. Pre-market and after-hours liquidity is often poor, and it cannot be treated as a confirmed closing result.
- Consider volume and the day's high/low: These two help judge whether the day's volatility is active, but they cannot alone prove that a trend has formed.
- Watch for the impact of dividends on charts: Nike has a cash dividend arrangement. Unadjusted prices may gap on the ex-dividend date; when comparing long-term trends, confirm whether the page is adjusted.
- Rely on the page's real-time data: This article does not hard-code the stock price or change at any moment.
How to read market cap?
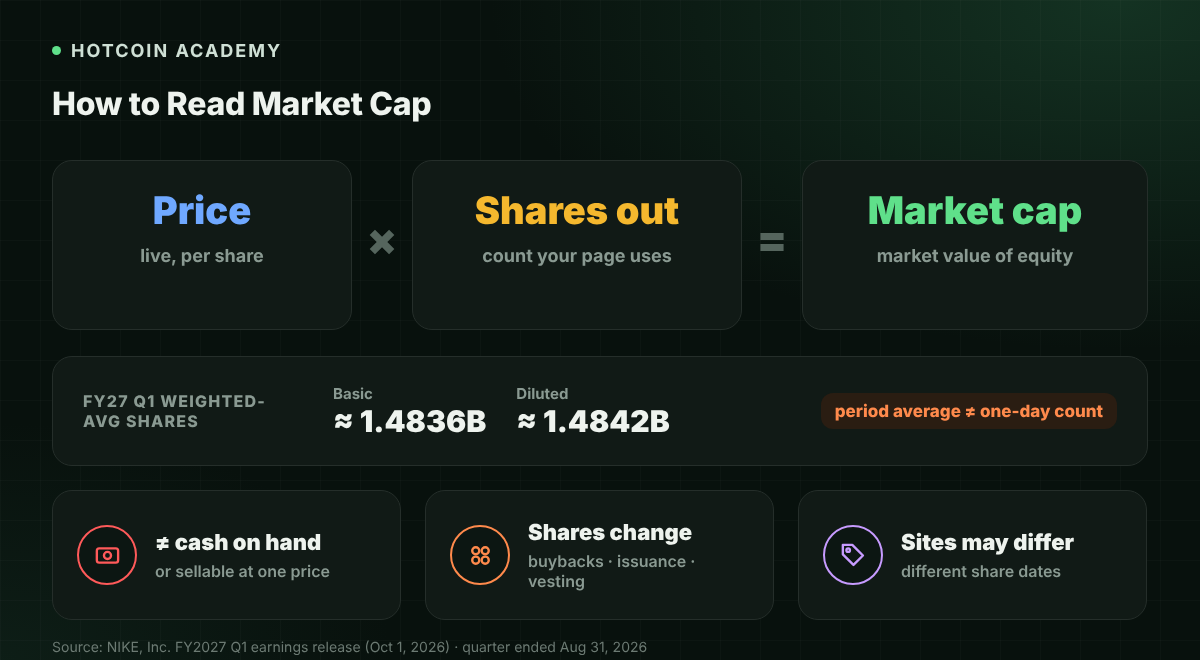
Market cap is generally estimated as follows:
Market cap ≈ current share price × shares outstanding
The share capital basis is subject to the explanation on the quote page. In its FY2027 Q1 results, Nike reported that the weighted average common shares used for basic earnings per share for the quarter were approximately 1.4836 billion, and on a diluted basis approximately 1.4842 billion. Both are period averages and are not equal to the shares outstanding at the close on any given day. Buybacks, issuance, or employee exercises will change share capital; calculations should use the figures adopted on the page at the time.
When reading market cap, remember: it is not the cash on the company's books, nor is it equal to the amount that could be obtained by selling all shares at once at the displayed price; different websites may use share capital from different points in time, so results may differ slightly.
Common misconceptions
- "NKE only represents the business of Nike stores in the US": Nike reports revenue across multiple regions, and Greater China, Europe, and Asia Pacific & Latin America all affect overall performance.
- "A big after-hours gain means tomorrow's open will be at the same price": Extended-hours trading is thin, and the opening price still waits for regular trading to re-match.
- "A high market cap means the company has more cash and is definitely safer": Market cap is an equity valuation and is not the same thing as cash reserves, inventory health, or earnings quality.
FAQ
Q1: On which exchange is NKE listed? NKE is the ticker for NIKE, Inc.'s common stock listed on the New York Stock Exchange.
Q2: What is the relationship between Nike and Converse? Converse is a wholly-owned subsidiary brand of NIKE, Inc. In FY2027 Q1, Nike Brand revenue was $10.952 billion and Converse revenue was $263 million; specific figures are subject to the company's latest release.
Q3: How is NKE's market cap calculated? Generally, the current share price is multiplied by shares outstanding. The weighted average shares in financial reports are used to calculate earnings per share and may not equal the share capital used on the quote page at a given moment; please refer to the page display.
Q4: Do pre-market or after-hours NKE prices count as the official closing price? No. The official closing price usually corresponds to the result at the end of regular trading hours; extended-hours prices are a separate session of trading.
Q5: Can the share price alone tell whether Nike is expensive? No. The share price does not include information such as share capital, earnings, inventory, and regional structure, nor can it alone constitute a basis for buying or selling.
Conclusion
NKE is the ticker for NIKE, Inc. listed on the NYSE. When reading this stock, first distinguish the revenue structure of Nike Brand and Converse, the various regions, and the wholesale/direct channels, then return to the quote page to read the live price and market cap; these figures will change with the market and share capital, and should be subject to the page's real-time display and the company's latest release.
If you see US stock-related prices on a crypto platform or quote page, you also need to first distinguish whether you are looking at listed company stock quotes, tokenized stocks, or other price-linked products. You can first read What are tokenized stocks? How to achieve 24/7 US stock trading.
Risk warning: This article is for educational and informational purposes only and does not constitute any investment advice or buy/sell recommendation. The financial figures in the text come from the company's published financial reports or earnings releases and may be updated by subsequent filings. US stock prices are highly volatile and may cause partial or total loss of principal. Please refer to the company's latest release and the real-time data on the page you are viewing, and make prudent decisions based on your own risk tolerance.
Đề xuất đọc
Xem thêm