What Is Futures Liquidation? Forced Liquidation and Liquidation Price Calculation
Futures liquidation, or forced liquidation, is the mechanism by which the system automatically closes a position when losses make the account margin insufficient to meet the platform's minimum maintenance margin requirement. The logic is straightforward: as unrealized losses grow, they keep eating into your margin, and once the liquidation price is reached, the loss takes your entire margin. Understanding the liquidation mechanism and how the liquidation price is calculated is the key to avoiding a passive wipeout.
How Does Liquidation Happen?
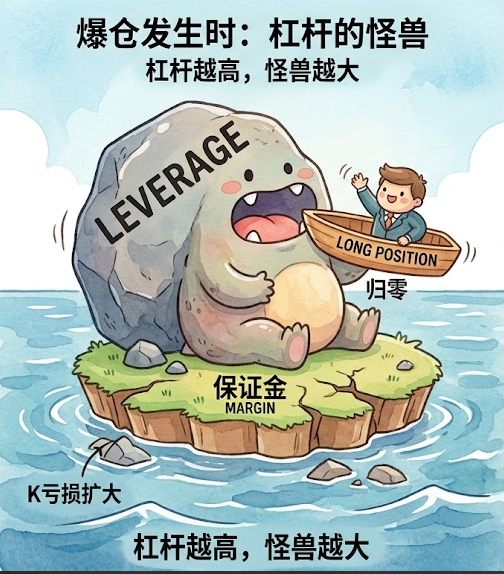
The core mechanism of futures trading is leverage: a small amount of margin controls a much larger position. That also means losses are magnified when the price moves against you, and those losses are deducted from your margin first.
When margin is eroded to the point where it approaches or even falls below the platform's maintenance margin, the system considers that your account can no longer support the position and triggers the forced liquidation process. When liquidation happens, your entire margin may be wiped out and the position is taken over by the system, ending the process.
In practice, exchanges usually refer to the mark price, rather than the last traded price, to decide whether to trigger liquidation. The mark price is a fair price derived from the index price and the funding rate, designed to avoid unreasonable forced liquidations caused by brief market manipulation or thin liquidity.
How Is the Liquidation Price Calculated?
The liquidation price depends closely on the margin mode you choose. The following uses a common linear, USDT-margined perpetual contract as an example.
Liquidation Price in Isolated Margin Mode
In isolated margin mode, each position has its own separate margin, so losses affect only that position and not the rest of the account. The liquidation price is relatively fixed, and the key question is how far the price must move against you to consume all of your margin:
Long (bullish): liquidation price = entry price × (1 - margin rate + maintenance margin rate)
Short (bearish): liquidation price = entry price × (1 + margin rate - maintenance margin rate)
Here, the margin rate is roughly 1 ÷ leverage multiple.
Example: suppose you use 100 USDT as margin to open a 100x leveraged long on BTC at 50,000 USDT, giving a position value of 10,000 USDT. If the platform's maintenance margin rate is 0.5%, then:
Margin rate = 1 ÷ 100 = 1%
Liquidation price ≈ 50,000 × (1 - 1% + 0.5%) = 50,000 × 99.5% = 49,750 USDT
This means that when BTC falls to 49,750 USDT, a drop of only 0.5%, your position will be liquidated and the entire 100 USDT margin is lost.

Liquidation Price in Cross Margin Mode
In cross margin mode, all available balances in the futures account form a shared margin pool used by every position. The liquidation price is therefore no longer a fixed figure; it changes dynamically with total account assets, the profit and loss of other positions, and other factors, so no fixed number can be calculated at entry. The system decides whether to trigger liquidation based on overall account risk, such as a risk ratio of 100% or above.
⚠️ Key point: the higher the leverage, the closer the liquidation price sits to the entry price. With high leverage, even a tiny adverse price move can wipe you out. Beginners should always start with low leverage and prefer isolated margin mode to contain risk.
What Happens After Liquidation?
Liquidation is not just a single step of clearing the position. The system usually goes through the following process:
Cancel open orders: unfilled orders related to the position are cancelled to release margin.
Reduce the position (on some platforms): if account risk is high, the system first closes part of the position and tries to restore the account to a safe state.
Liquidate: if reducing the position does not work or the situation is urgent, the system takes over the position at the bankruptcy price and closes it in full.
The bankruptcy price is the price at which the position margin is completely depleted. When liquidation occurs, if the system's actual closing price is better than the bankruptcy price, the surplus margin goes into the platform's insurance fund; if the closing price is worse than the bankruptcy price, meaning losses exceed the margin, the insurance fund covers the shortfall so that traders' accounts do not end up with a negative balance.

Frequently Asked Questions (FAQ)
Q1: When is forced liquidation triggered?
Liquidation is triggered when the position margin ratio falls to the maintenance margin level required by the platform. It usually shows up as a risk ratio of 100% or above, meaning account equity is not enough to cover the maintenance margin.
Q2: Does the mark price or the last price decide liquidation?
Exchanges usually use the mark price to decide whether to trigger liquidation, so that users are not liquidated by mistake because of a momentary extreme trade price.
Q3: How do long and short liquidation price calculations differ?
For a long position, a falling price triggers liquidation; for a short position, a rising price triggers liquidation. Put simply, a bullish position loses and gets liquidated as the price falls, while a bearish position gets liquidated as the price rises.
Q4: Will all of my margin be lost after liquidation?
Usually, liquidation means your entire margin, or the isolated margin of that position, has already been depleted. The system tries to close at a price better than the bankruptcy price, but the loss is essentially borne by your margin.
Related tutorials:
Complete Guide to Futures Trading: From the Basics to Risk Control
Leverage Trading Explained: Amplifying Gains and Risks Alike
Futures Take-Profit and Stop-Loss Guide: Protecting Your Profits
What Is the Funding Rate? The Price Anchor Mechanism of Perpetual Futures
Recommended reading:
Đề xuất đọc
Xem thêm