
Common Candlestick Patterns and Buy/Sell Signals
Candlestick patterns are among the most intuitive sources of trading signals in technical analysis. From a single hammer to multi-candle formations such as engulfing patterns and three white soldiers, specific candle arrangements often suggest a trend reversal or continuation. Academic research indicates that some bullish patterns, including bullish engulfing, can produce statistically significant positive returns, while bearish formations such as bearish engulfing and hanging man may precede notable price declines. Understanding these common patterns is a key step from simply reading charts to using them in trading decisions.
What Is a Candlestick Pattern?
A single candlestick only reflects the contest between buyers and sellers during one time period, so its analytical value is limited. When multiple candles appear in a particular sequence, they form a candlestick pattern. These patterns reveal shifts in the balance of buying and selling pressure and suggest that price may reverse or continue in its current direction.
Candlestick patterns generally fall into three categories: reversal patterns, which suggest a possible change in trend; continuation patterns, which indicate that the trend may persist; and indecision patterns, which show that direction remains uncertain. Beginners should start with the following practical patterns, whose signals are comparatively clear.
Bullish Reversal Patterns (Bottom Signals)
These patterns usually appear near the end of a downtrend and suggest that price may stabilize and rebound.
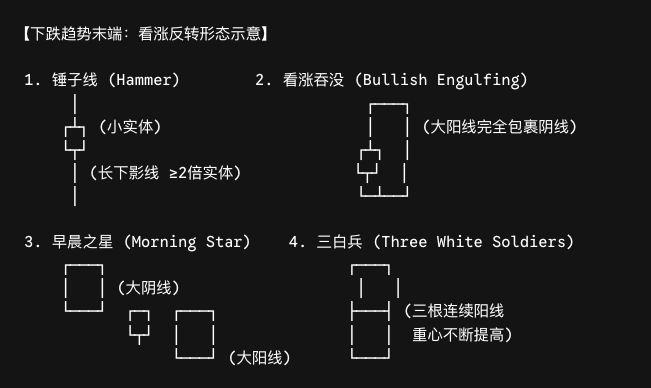
Hammer
Characteristics: It appears in a downtrend, has a small body of either color, places the body near the top of the candle, and has a lower wick at least twice the length of the body with little or no upper wick.
Meaning: Sellers initially push the price sharply lower, but buyers drive it back near the opening price, indicating strong demand below. A green hammer generally carries a stronger bullish signal than a red hammer.
Confirmation required: If the next candle also closes higher, the reversal signal gains confirmation.
Bullish Engulfing
Characteristics: This two-candle pattern appears in a downtrend. The first candle is bearish, while the second is bullish and its real body completely covers the first candle's body.
Meaning: Selling pressure is fully expressed in the first candle, but buyers completely overwhelm it in the next one. The abrupt shift from bearish to bullish sentiment makes this a comparatively strong reversal signal.
Morning Star
Characteristics: This three-candle pattern appears in a downtrend: a bearish candle, followed by a doji or small-bodied candle, and then a bullish candle. The third candle should close well inside the body of the first bearish candle.
Meaning: The first candle extends the decline, the second shows a temporary balance and hesitation between buyers and sellers, and the third confirms that buyers have regained control. Its signal is stronger than that of a single hammer.
Three White Soldiers
Characteristics: Three consecutive bullish candles appear, with each opening inside the previous candle's body and closing above the previous high. Their lower wicks are short or absent.
Meaning: Buyers steadily lift the price across three consecutive periods, with momentum continuing to strengthen. The pattern often appears near the end of a downtrend or after a breakout from consolidation, signaling a forceful reversal or the start of a trend.
Bearish Reversal Patterns (Top Signals)
These patterns usually appear near the end of an uptrend and suggest that price may peak and decline.
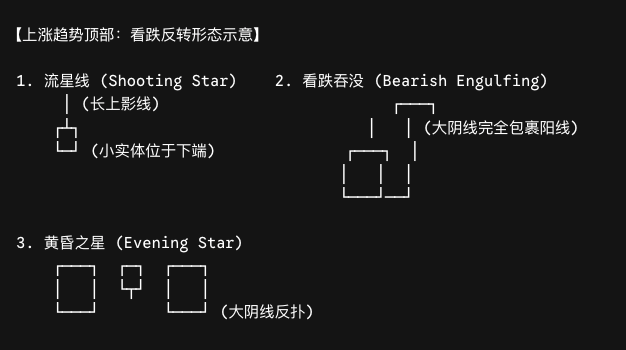
Shooting Star
Characteristics: It appears in an uptrend, has a small body near the bottom of the candle, and has an upper wick at least twice the length of the body with little or no lower wick.
Meaning: Buyers initially drive the price sharply higher, but sellers push it back near the opening price, revealing heavy overhead supply. It is an early warning that bullish momentum is weakening.
Bearish Engulfing
Characteristics: This two-candle pattern appears in an uptrend. The first candle is bullish, while the second is bearish and its real body completely covers the first candle's body.
Meaning: Buying enthusiasm is fully displayed in the first candle, but sellers completely overwhelm it in the next one. The sudden turn in sentiment makes this a comparatively strong signal of a bearish reversal near a market top.
Evening Star
Characteristics: This three-candle pattern appears in an uptrend: a bullish candle, followed by a doji or small-bodied candle, and then a bearish candle. The third candle should close well inside the body of the first bullish candle.
Meaning: The first candle extends the rise, the second shows balance and fading upward momentum, and the third confirms that sellers have regained control.
Indecision Pattern: Doji
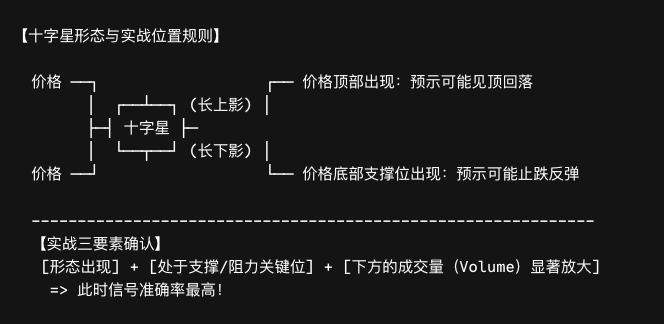
Characteristics: The opening and closing prices are nearly equal, producing an extremely small body, while the upper and lower wicks may differ in length.
Meaning: Buyers and sellers are evenly matched, leaving the market's direction unresolved. A doji is not a buy or sell signal by itself; it is an alert that the current trend may be losing momentum and that the market is preparing to choose a direction. Context matters: a doji near the top of an uptrend may precede a decline, while one near the bottom of a downtrend may precede a rebound.
⚠️ Important: A doji requires confirmation from the next candle and should not be used alone as an entry or exit trigger.
Rules and Common Mistakes When Using Candlestick Patterns
Three Core Principles
Location matters more than the shape itself. The same pattern can mean entirely different things in different contexts. A hammer is meaningful near the bottom of a downtrend, whereas the same shape near the top of an uptrend may be a hanging man, which is bearish.
Wait for confirmation. Most candlestick patterns are warnings rather than immediate trade commands. Do not enter the moment a pattern appears; wait for the next candle to move in the same direction and confirm the signal.
Volume is essential supporting evidence. A pattern accompanied by rising volume is generally more reliable than one formed on low volume. For example, a bullish engulfing pattern becomes much more credible when trading volume expands.
Common Mistakes
Mistake 1: Trading whenever a recognizable pattern appears. Candlestick patterns are probability tools, not guaranteed signals. Even a textbook formation can fail completely.
Mistake 2: Ignoring the broader trend. Attempting a countertrend reversal in a powerful trend is risky. For example, a shooting star inside a strong uptrend is much less reliable than one that appears in a consolidation area near the top.
Mistake 3: Making decisions with candlestick patterns alone. Combine patterns with support and resistance, trading volume, and indicators such as RSI and MACD to obtain confirmation from multiple dimensions.
What Does Academic Research Say?
The real-world effect of candlestick patterns is not purely subjective. A large empirical study covering nearly 400 cryptocurrencies, 2,000 trading pairs, 36 exchanges, and 200 million observations found that some candlestick patterns have statistically significant predictive power. Bullish engulfing and Hikkake patterns generated significant positive returns, while bearish engulfing and hanging man patterns preceded significant declines. The findings remained consistent across different market conditions, assets, and exchanges.
Another study backtested hourly Bitcoin data from 2017 to 2025 and used a fuzzy-logic model to identify candlestick patterns. Across 6,761 to 10,891 trades, it achieved a 55.8% win rate and approximately USD 188,000 in net profit, substantially outperforming a buy-and-hold strategy.
These studies suggest that candlestick patterns are not market superstition but probability tools that can be tested across large datasets. However, the research also emphasizes that patterns must be combined with other tools, such as trend filters and position management, to produce stable results. A pattern is one component of a trading system, not the entire system.
Frequently Asked Questions (FAQ)
Q1: Are candlestick pattern signals always accurate?
No. Candlestick patterns describe probabilities rather than certainties. Even strong signals such as bullish engulfing or three white soldiers can fail in unusual market conditions. Their reliability depends on location, volume confirmation, and the broader trend.
Q2: Which candlestick timeframe should I use?
It depends on your trading style. Patterns on the daily (1D) and four-hour (4H) charts are generally more reliable and contain less noise. Patterns on 15-minute or one-hour charts may suit short-term trading but produce more false signals. A practical approach is to identify the trend on a higher timeframe, such as the daily chart, and then find a precise entry on a lower timeframe.
Q3: What is the key difference between a hammer and a shooting star?
A hammer appears near the bottom of a downtrend, has its body near the top and a long lower wick, and suggests a possible rebound. A shooting star appears near the top of an uptrend, has its body near the bottom and a long upper wick, and suggests a possible decline. The two are mirror images, but their opposite locations give them completely different meanings.
Q4: Does a doji always lead to a reversal?
No. A doji only indicates that buying and selling pressure are temporarily balanced and that direction is uncertain. It tells traders to watch the area, but the next candle must confirm the eventual direction. A bullish candle after the doji supports a bullish interpretation, while a bearish candle supports a bearish one.
Related tutorials:
- Cryptocurrency Technical Analysis for Beginners: From Candlesticks to a Trading System
- How to Read Candlestick Charts: A Beginner's First Lesson
- Support and Resistance: Finding Key Price Zones
- Volume Analysis: Reading the Relationship Between Price and Volume
- Moving Averages Explained: Using MA and EMA to Identify Trends
- RSI Indicator: A Practical Guide to Overbought and Oversold Conditions
- MACD Explained: Trend Following and Divergence Signals
Recommended reading:
Đề xuất đọc
Xem thêm



Service@hotcoin.com
Product@hotcoin.com
Business@hotcoin.com
Casecn@hotcoin.com