
Hotcoin Research | Legacy Exchanges Exit & On-Chain Signals Bottom Out: How Far Is the Crypto Market From a Turning Point?
Introduction
Since July 2026, the crypto industry has witnessed a wave of platform exits and shutdowns. AscendEX ceased operations on July 1; BitMEX, a pioneer of high-leverage perpetual contracts, announced it will shut down its exchange on September 23; and BitMart, after nine years of operation, initiated an orderly wind-down on July 26, planning to fully terminate its platform operations by late January 2027. Concurrently, a series of protocols and projects—including Zero Network, Everclear, Syndicate Labs, and Fantasy.top—have either ceased operations or entered a phase of downsizing.
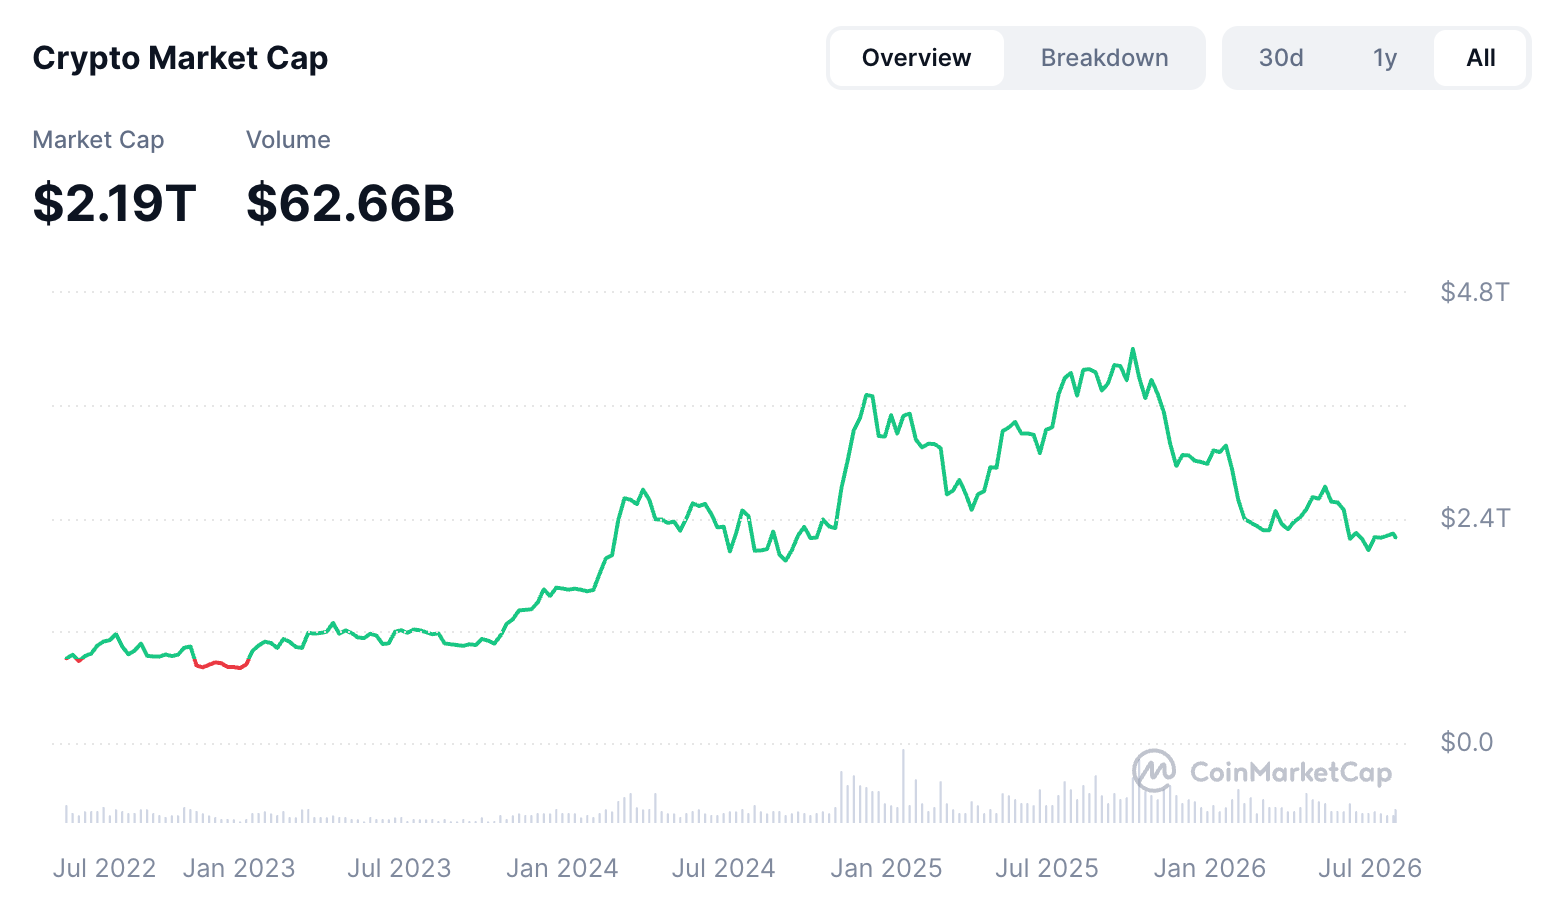
This wave of exits comes after nearly ten months of market adjustment. Bitcoin reached a cycle high of approximately $126,236 on October 6, 2025, before dropping to a low of around $57,740 in July 2026, with a maximum drawdown of roughly 54%. According to data from CoinMarketCap, total crypto market capitalization also fell from its October 2025 peak of ~$4.2 trillion to a July 2026 low of ~$2.04 trillion, marking a decline of over 50%. As prices, trading volumes, fundraising, and project debuts contract in tandem, the market exhibits textbook characteristics of a "concentrated capitulation" phase late in a bear market. The pivotal question remains: Is this wave of exchange and project shutdowns a sign of an impending market bottom, or merely the outcome of deteriorating industry demand?
Source: https://coinmarketcap.com/charts/
-
Implications of the Closure Wave: Bear Market Stress Has Transmitted to Industry Operations
Asset prices typically price in expectations first, whereas business operations often take several months or even a year to reveal underlying vulnerabilities. Exchanges can temporarily sustain operations on accumulated transaction fees, while project teams rely on fundraising reserves and token treasuries. As a result, platform shutdowns are usually a lagged consequence of shrinking revenues, halted funding, and compounding cost pressures. Crucially, today’s exits are no longer confined to user-scarce, small-scale projects—they now include veteran exchanges that operated for years and once held a prominent market stature.
1.1 Three old exchanges shut down: scale and history are no longer a safety cushion
AscendEX, BitMEX, and BitMart announced their shutdowns in succession this July, yet each represents a distinct narrative. Regulatory pressure, market share erosion, and declining operational efficiency drove their respective exits. What truly warrants attention is not who fell first, but that the foundational conditions for an exchange's survival have shifted: an extended operating history, inflated order book volumes, or even a legacy of pioneering industry products no longer guarantee the ability to navigate cycles safely.
AscendEX demonstrates that regulation is not an external variable isolated from bear markets: as revenues plummet, licensing, audits, AML compliance, and localized teams transform into crushing fixed costs. BitMEX illustrates that inventing a product does not grant permanent market dominance; once perpetual contracts became an industry standard, competitive moats shifted to liquidity depth, user acquisition funnels, and risk management systems. BitMart proves that trading volume does not equal operational health. Facing ongoing pressures from market making, compliance, customer support, and withdrawals, an exchange only derives true business value from volume that converts into sustainable fee revenue and long-term user retention.
Therefore, the exit of these three platforms cannot be reduced to a simple narrative of "a bear market bankrupting exchanges." The core signal released by the sequential departures of veteran exchanges is not that every platform faces a solvency crisis, but that the industry's safety cushions are thinning: past history only proves a platform's historic success; only sustained cash flow, credible redemption capabilities, and compliant operations will determine whether it can remain at the table.
1.2 Over 100 projects collapse, yet "shutdown" manifests in divergent states
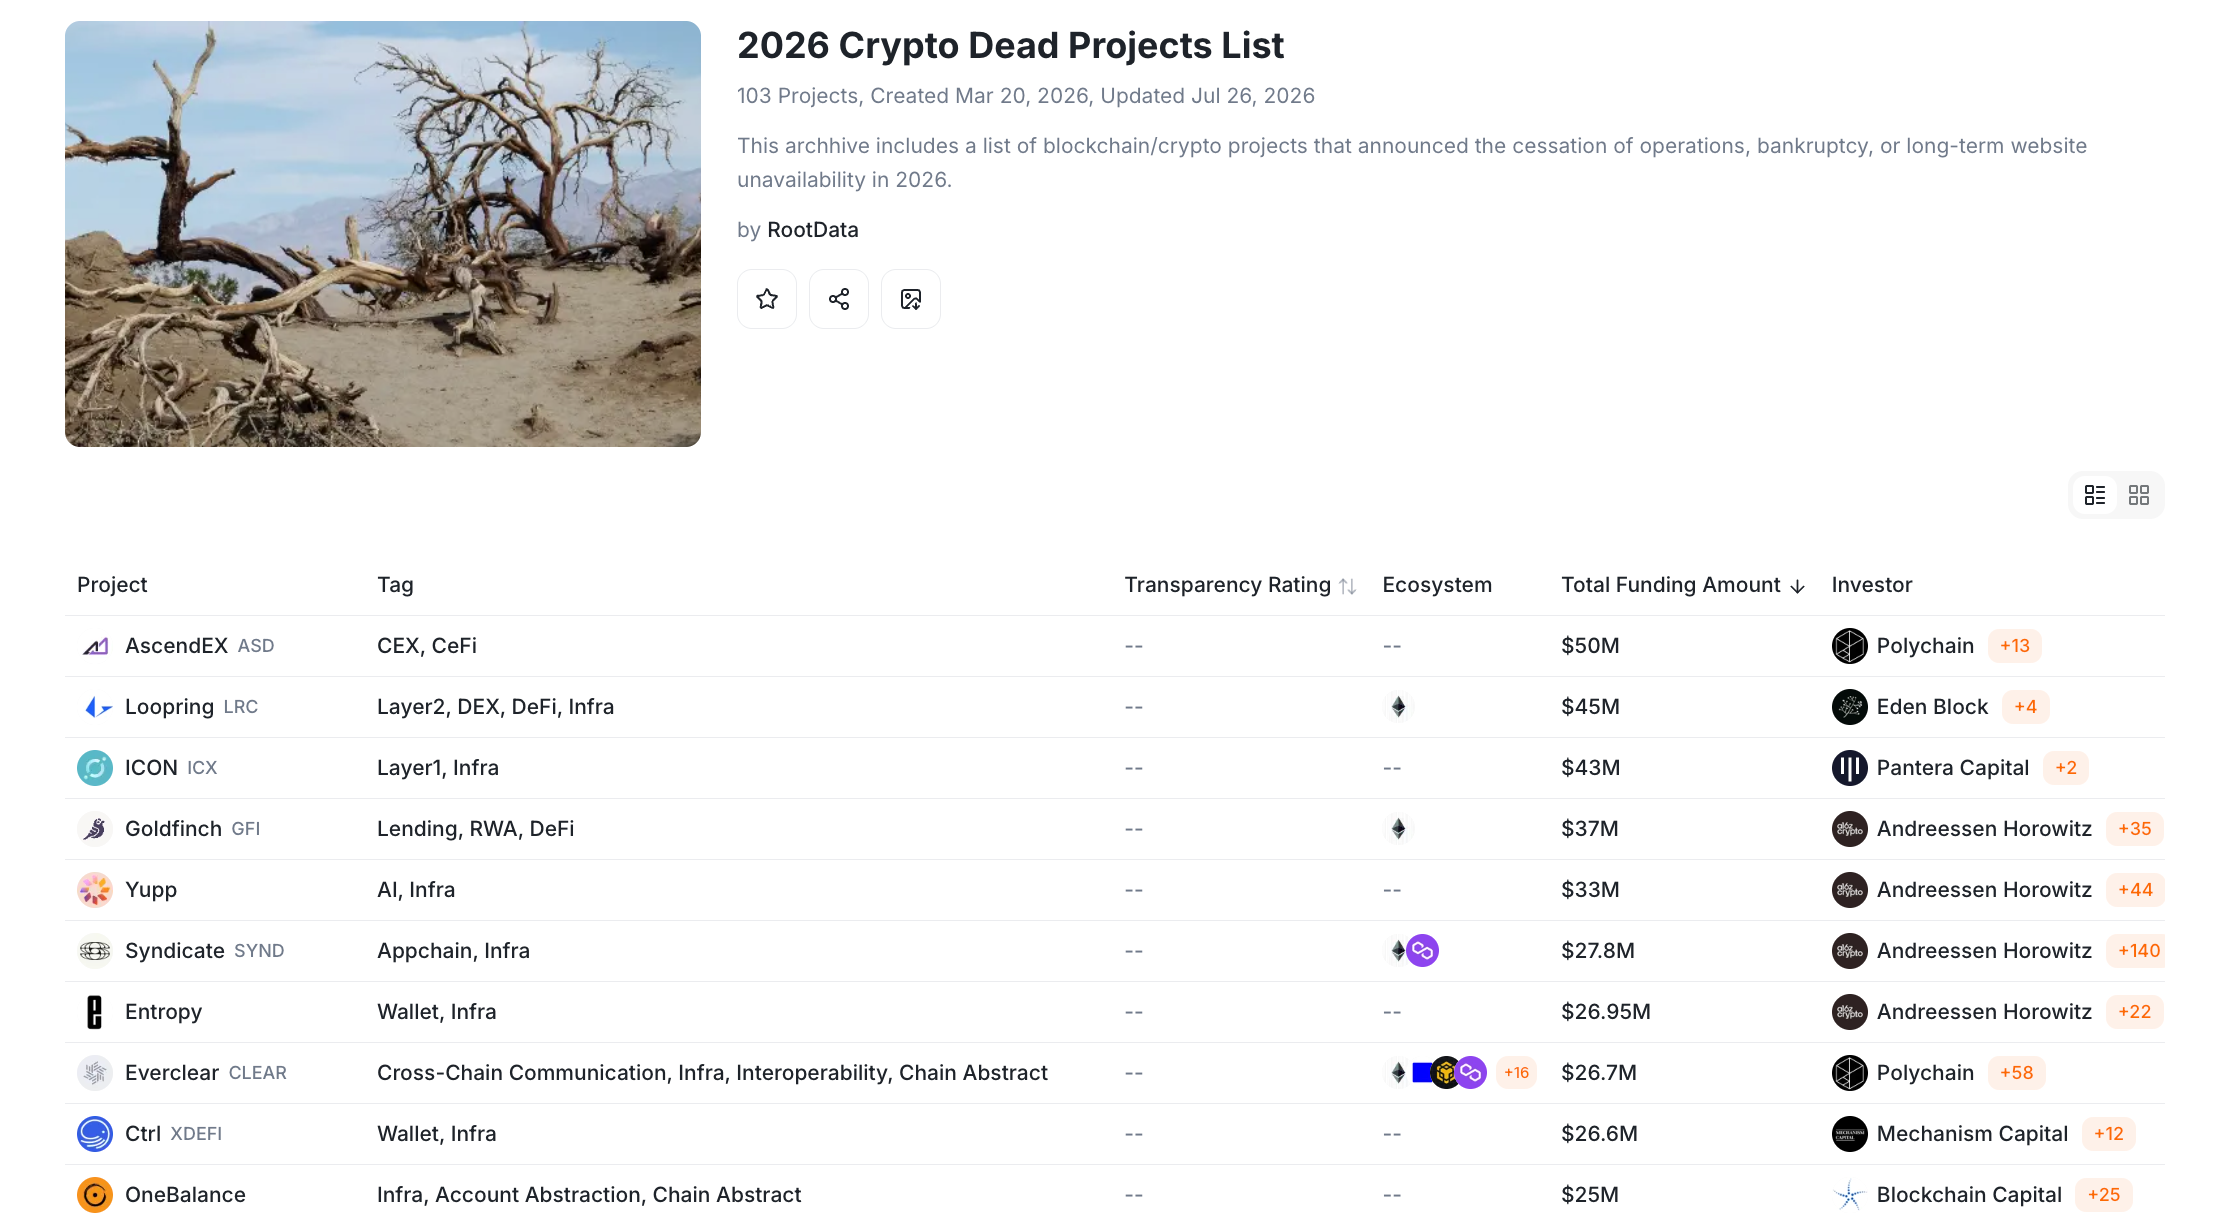
According to RootData, the "Crypto Dead Projects List" for 2026 has already accumulated 103 projects. This figure underscores a clear acceleration in industry-wide attrition.
Source: https://www.rootdata.com/archives/detail/
RootData’s tracking scope includes projects that have officially announced shutdowns, entered bankruptcy proceedings, suffered prolonged website downtime, or ceased product operations for an extended period—revealing substantial variations in their actual terminal states. For instance, Zero Network initiated its shutdown after roughly 1.5 years of operation; Everclear closed its core front-ends, protocol, foundation, and research arms; Syndicate Labs acknowledged the struggle of Rollup infrastructure to acquire a viable client base; while Fantasy.top discovered its crypto trading cards attracted pure speculators rather than a sticky player base. Across these diverse cases, the shared fatal flaw was not a lack of narrative, but an inability to generate real demand and sustainable revenue to offset ongoing development costs.
Other cases cannot be simply classified as "flatlines." Balancer Labs dissolved its corporate entity following a ~$110M security breach; however, the protocol itself plans to downsize its product offerings, sunset legacy incentives, and remain operational. Meanwhile, ICON Network will deprecate its legacy blockchain by year-end, migrating its assets and functionalities to SODAX. The former represents a corporate restructuring, while the latter constitutes an ecosystem migration—neither is equivalent to a total wipeout of the ecosystem.
1.3 Shutdown wave signals the latter half of the bear market, yet remains a potential catalyst for fresh selling pressure
Historically, corporate shutdowns typically lag behind severe market drawdowns. At the peak of a bull market, projects enjoy inflated token treasury valuations and easy access to venture capital. Even in the absence of organic cash flows, teams can sustain operations for years through token unlocks, foundation grants, or VC funding. It is only when token prices plunge, fundraising valuations contract, and market-making depth thins that the structural issues previously masked by asset appreciation are forcefully exposed.
Consequently, this wave of shutdowns exhibits a pronounced lag effect. It signifies that the previous expansion cycle is being settled, yet fails to pinpoint the precise market bottom. On the contrary, the sunsetting process can exacerbate short-term market friction: exchanges must liquidate positions, project teams may dump treasury assets, investors scramble to redeem and migrate funds, and both platform tokens and project tokens face intense sell-offs due to collapsing expectations. While market clearing reduces long-term token supply, it often triggers a fresh wave of short-term selling pressure first.
True signals of a market bottom are not defined by an accumulation of bad news, but rather by the diminishing marginal impact of such news on price action. If BTC resists breaking to new lows following fresh shutdowns, security exploits, or regulatory crackdowns, it indicates that sell-side exhaustion has set in and long-term capital is absorbing the remaining supply overhang.
-
Structural Shifts in the Market: Capital Refuses to Pay for Cash-Flow-Negative Growth
Beneath the surface, this wave of shutdowns reflects a deeper structural shift: the crypto industry’s capital supply, liquidity distribution, and user demand are all undergoing a fundamental overhaul. In the previous cycle, numerous projects relied on liquidity subsidies to buy TVL, airdrop farming to inflate active addresses, and token price appreciation to mask underlying losses. As external capital ebbs, the market is returning to first-principles questioning: Who is actually using the product? Who is willing to pay? And can revenue cover security, compliance, and core development costs?
2.1 Transmission mechanism of price-volume contraction across the revenue chain
The market inflection in October 2025 manifested first in falling asset prices and unwinding leveraged positions. According to TokenInsight data, a tariff-induced shock in October 2025 triggered approximately $19 billion in liquidations, initiating a sustained period of deleveraging across the exchange sector. By Q1 2026, total trading volume across 20 major exchanges had dropped to $17.9 trillion—a 32% quarter-over-quarter (QoQ) decline and a 42% decrease from the cycle peak of $31 trillion in Q3 2025. Within this total, derivatives volume stood at $14.6 trillion while spot volume accounted for $3.3 trillion, both sinking to multi-quarter lows.
Declining asset prices and shrinking trading volumes propagate rapidly down the revenue chain. Exchanges experience diminished trading fee revenues while remaining burdened by fixed operational costs, including system maintenance, security infrastructure, customer support, market-making, and regulatory compliance. Concurrently, project teams face a triple blow: depreciating treasuries, deteriorating fundraising prospects, and ineffective token incentives. Meanwhile, venture capital firms tighten follow-on funding as exit liquidity dries up. This ultimately forms a vicious cycle: Declining Prices $$\rightarro$$ Shrinking Volume $$\rightarro$$ Falling Revenue $$\rightarro$$ Tightening Capital $$\rightarro$$ Team Downsizing $$\rightarro$$ Product Sunsetting.
Many projects raised three to five years of operational runway during the 2021–2022 funding peak, bringing them precisely to a capital exhaustion window in 2025–2026. Lacking sustainable revenue streams, teams are left with a grim choice: down-round fundraising, fire sales, pivoting to AI, or shuttering operations entirely. The bear market is merely an accelerator; ultimate survival is determined by unit economics.
2.2 Industry enters a new phase: selective incubation and capital consolidation
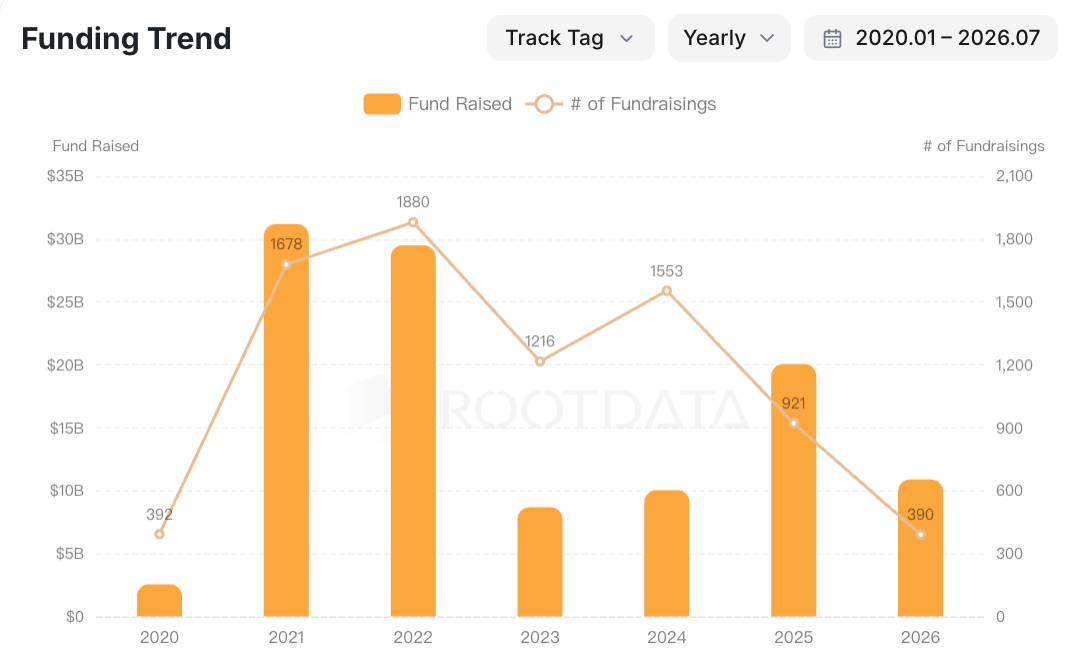
According to RootData statistics covering over 20,000 projects, the number of new monthly projects has dropped below 80 since entering 2026, falling back to levels not seen since prior to August 2020. Concurrently, deal count in private fundraising has declined for three consecutive years—marking the longest primary market contraction on record for the crypto industry. Crucially, even as BTC reached a new all-time high in 2025, it failed to reignite a broad-based expansion across the primary market.
Source: https://www.rootdata.com/dashboard
A defining divergence in this cycle is that a new high in BTC no longer guarantees a broad-based rally across all sectors. Capital is concentrating selectively into stablecoins, payments, trading infrastructure, prediction markets, and Real-World Assets (RWA), while refusing to fund copycat projects driven by the obsolete "subsidize first, grow later" doctrine.
On the other hand, M&A activity is heating up counter-cyclically. RootData metrics reveal that the crypto industry completed 267 mergers and acquisitions in 2025—a year-over-year surge exceeding 50%. In the first half of 2026 alone, 75 transactions were closed with an aggregate valuation surpassing $9 billion. The simultaneous drop in venture funding and surge in M&A indicates that capital is pivoting from "building more new projects" to "acquiring existing users, licenses, teams, and infrastructure at discounted valuations." This reflects not an industry in stagnation, but a fundamental paradigm shift in growth—from venture capital-driven expansion to strategic industry consolidation.
2.3 Consolidation of liquidity toward tier-1 platforms
According to TokenInsight metrics, the top five exchanges commanded 72.17% of total trading volume in Q1 2026, with market concentration reaching even higher levels in the derivatives sector. Simultaneously, on-chain perpetual platforms like Hyperliquid are emerging as formidable competitors, capturing substantial market share in capital retention and open interest.
BitMEX’s retreat epitomizes this structural transformation. While the product it pioneered continues to thrive, the perpetual contract itself has become highly commoditized. Users no longer evaluate venues based on who invented the perpetual swap, but on who offers broader asset coverage, lower execution costs, deeper order book liquidity, superior mobile user experience, and greater transparency in proof-of-reserves and risk management. Historical credentials of innovation can no longer substitute for present-day network effects.
Security, regulatory compliance, and centralization are not novel challenges for 2026; however, during bull markets, peak revenues temporarily absorb these overheads. Bear markets ruthlessly weed out projects whose risk-adjusted costs outstrip sustainable income. Regardless of open-source codebases or grand narratives, without monetization, teams cannot sustain ongoing audit and R&D expenditures. The essence of this market clearance is a fundamental repricing of cash flows, user retention, and risk-bearing capacity by capital allocators.
-
Troughing Signals Accumulate, but Bottom Confirmation Remains Pending
While business clearance addresses whether industry supply has begun to contract, price inflection points depend on the exhaustion of marginal sellers and the return of marginal buyers. Assessing a market bottom requires moving beyond reliance on isolated indicators. RSI oversold conditions can persist for weeks, depressed MVRV ratios can drift further downward, and negative funding rates often merely reflect short-term short congestion. A more effective methodology is to deconstruct the market bottom into distinct dimensions—valuation reset, leverage unwinding, holder capitulation, and demand recovery—and observe whether they converge into a holistic resonance.
3.1 Valuations compression reaches historical lows, but full-scale capitulation remains absent
As of July 30, 2026, Bitcoin trades at approximately $64,394, down roughly 49% from its all-time high of around $126,236 on October 6, 2025. The cycle low touched $57,740, representing a maximum drawdown of approximately 54%. This drawdown depth exceeds that of typical bull market corrections, yet remains milder than the classic bear market drawdowns of over 70% witnessed in 2018 and 2022. This shallower correction may stem from spot ETFs and institutional inflows fundamentally altering ownership structure; alternatively, it may imply that the market has yet to undergo a final wave of capitulation.
On-chain valuation metrics have cooled off significantly. Data from Axel Adler Jr. as of July 30 shows that Bitcoin’s MVRV ratio sits at approximately 1.21, well below its historical median of 1.62 and its 365-day moving average of 1.59. The MVRV (Market Value to Realized Value) ratio measures current market prices against the aggregate on-chain cost basis of all holders; an MVRV of 1.0 indicates that market capitalization equals the network's collective cost basis. The current reading of 1.21 implies that the market retains a roughly 21% unrealized profit cushion, approaching aggregate cost territory but staying above the sub-1.0 discounted levels observed during capitulation phases in 2015, 2018, and 2022.
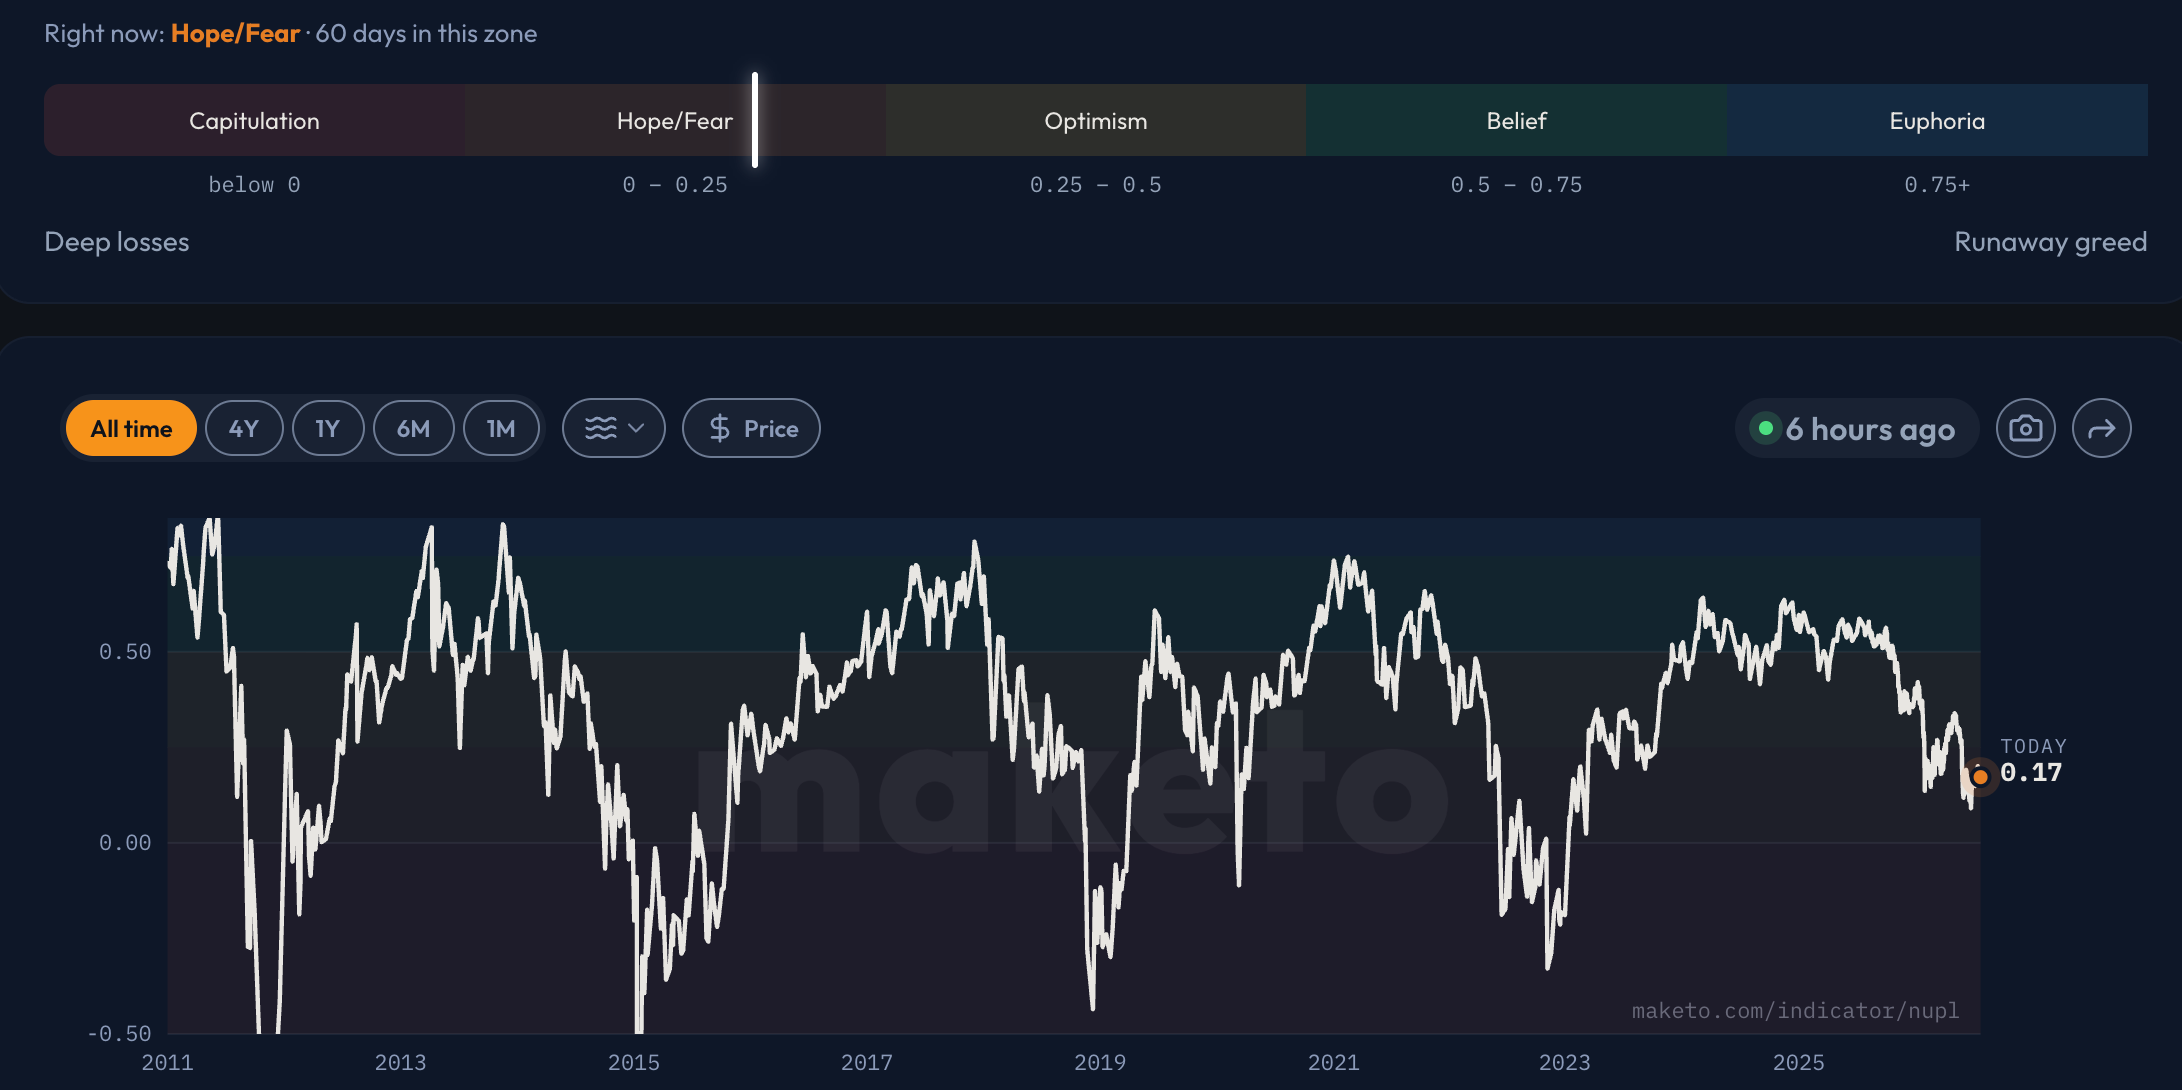
BTC Net Unrealized Profit/Loss (NUPL) currently hovers around 0.17, remaining anchored in the "Hope/Fear" zone and indicating that the overall market retains only a razor-thin margin of unrealized profit. Concurrently, as of July 30, approximately 53.7% of the circulating Bitcoin supply remains in profit—approaching a balanced breakeven split, a level lower than what has been observed in only ~12% of trading days over the past four years. These metrics reinforce the assessment that "valuations have entered the late stage of a bear market," yet they do not reflect widespread, deep unrealized losses across network holders.
Source: https://maketo.com/indicator/nupl
3.2 Substantial deleveraging completed, but leverage rebuilding has begun
Assessing whether a market bottom is near requires evaluating leverage flushout alongside price drawdowns. According to CoinGlass data, total crypto derivatives Open Interest (OI) stood at approximately $99.9 billion as of June 30, 2026, marking a 17.9% decline year-to-date, while H1 derivatives trading volume contracted by 15.7% year-over-year. This points to a palpable phase of forced deleveraging; however, because the contraction in OI did not meaningfully outpace the drop in trading volume, a substantial volume of risk-exposed positions continues to linger in the market.
Entering July, the deleveraging process paused its unidirectional contraction. As of July 28, BTC futures Open Interest (OI) recovered to approximately $47.54 billion (+6.83% over the prior 30 days), while ETH Open Interest surged 19.42% to ~$26.89 billion. Meanwhile, funding rates for both BTC and ETH remain anchored near neutral levels, indicating that the market has not yet reached extreme directional congestion. Consequently, this newly accumulated leverage remains exceptionally sensitive to potential price pullbacks.
Therefore, a more precise assessment is that while the high leverage of the prior cycle has been significantly compressed, the market began re-leveraging in July. A genuinely healthy cyclical inflection point should be led by a recovery in spot trading volume, ETF inflows, and stablecoin supply, which subsequently drives a measured growth in Open Interest. If derivatives positioning consistently outpaces spot capital inflows, what appears to be a bottom breakout may in reality be nothing more than the re-accumulation of risk for the next liquidation cascade.
3.3 Miners and holders face mounting stress, yet a concerted capitulation signal has not materialized
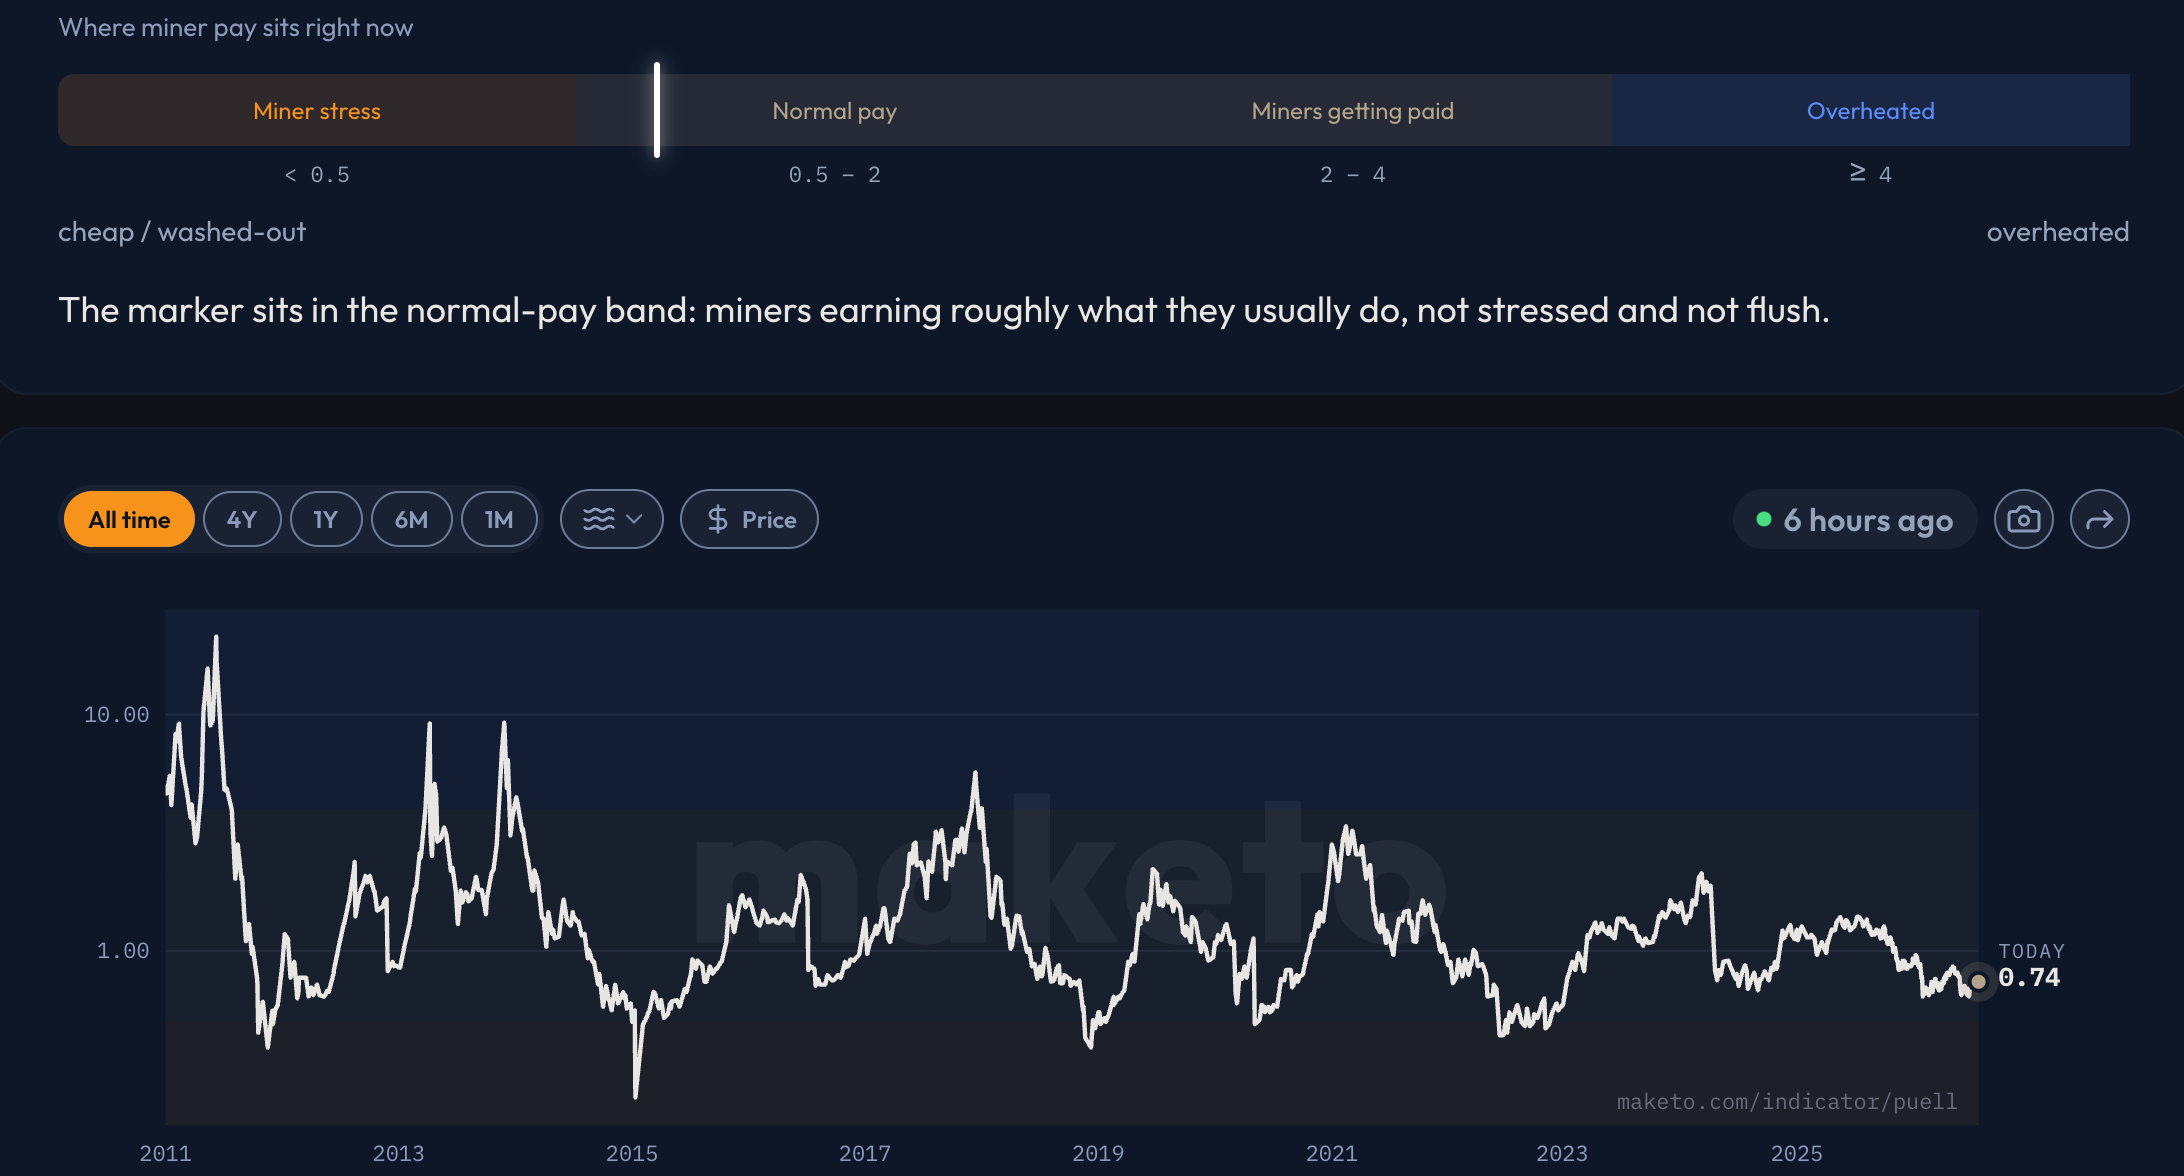
Miners represent the closest cohort to "forced sellers" in the crypto market, as they must continuously liquidate BTC revenues to cover electricity, hardware, and debt service costs. The Puell Multiple calculates the daily USD value of newly issued BTC divided by its 365-day moving average; a lower reading indicates weaker miner revenue relative to historical baselines. As of July 30, the metric printed at approximately 0.73, placing it in the lower range of the past four years, yet remaining well above the 0.5 threshold historically associated with extreme miner distress.
Source: https://maketo.com/indicator/puell
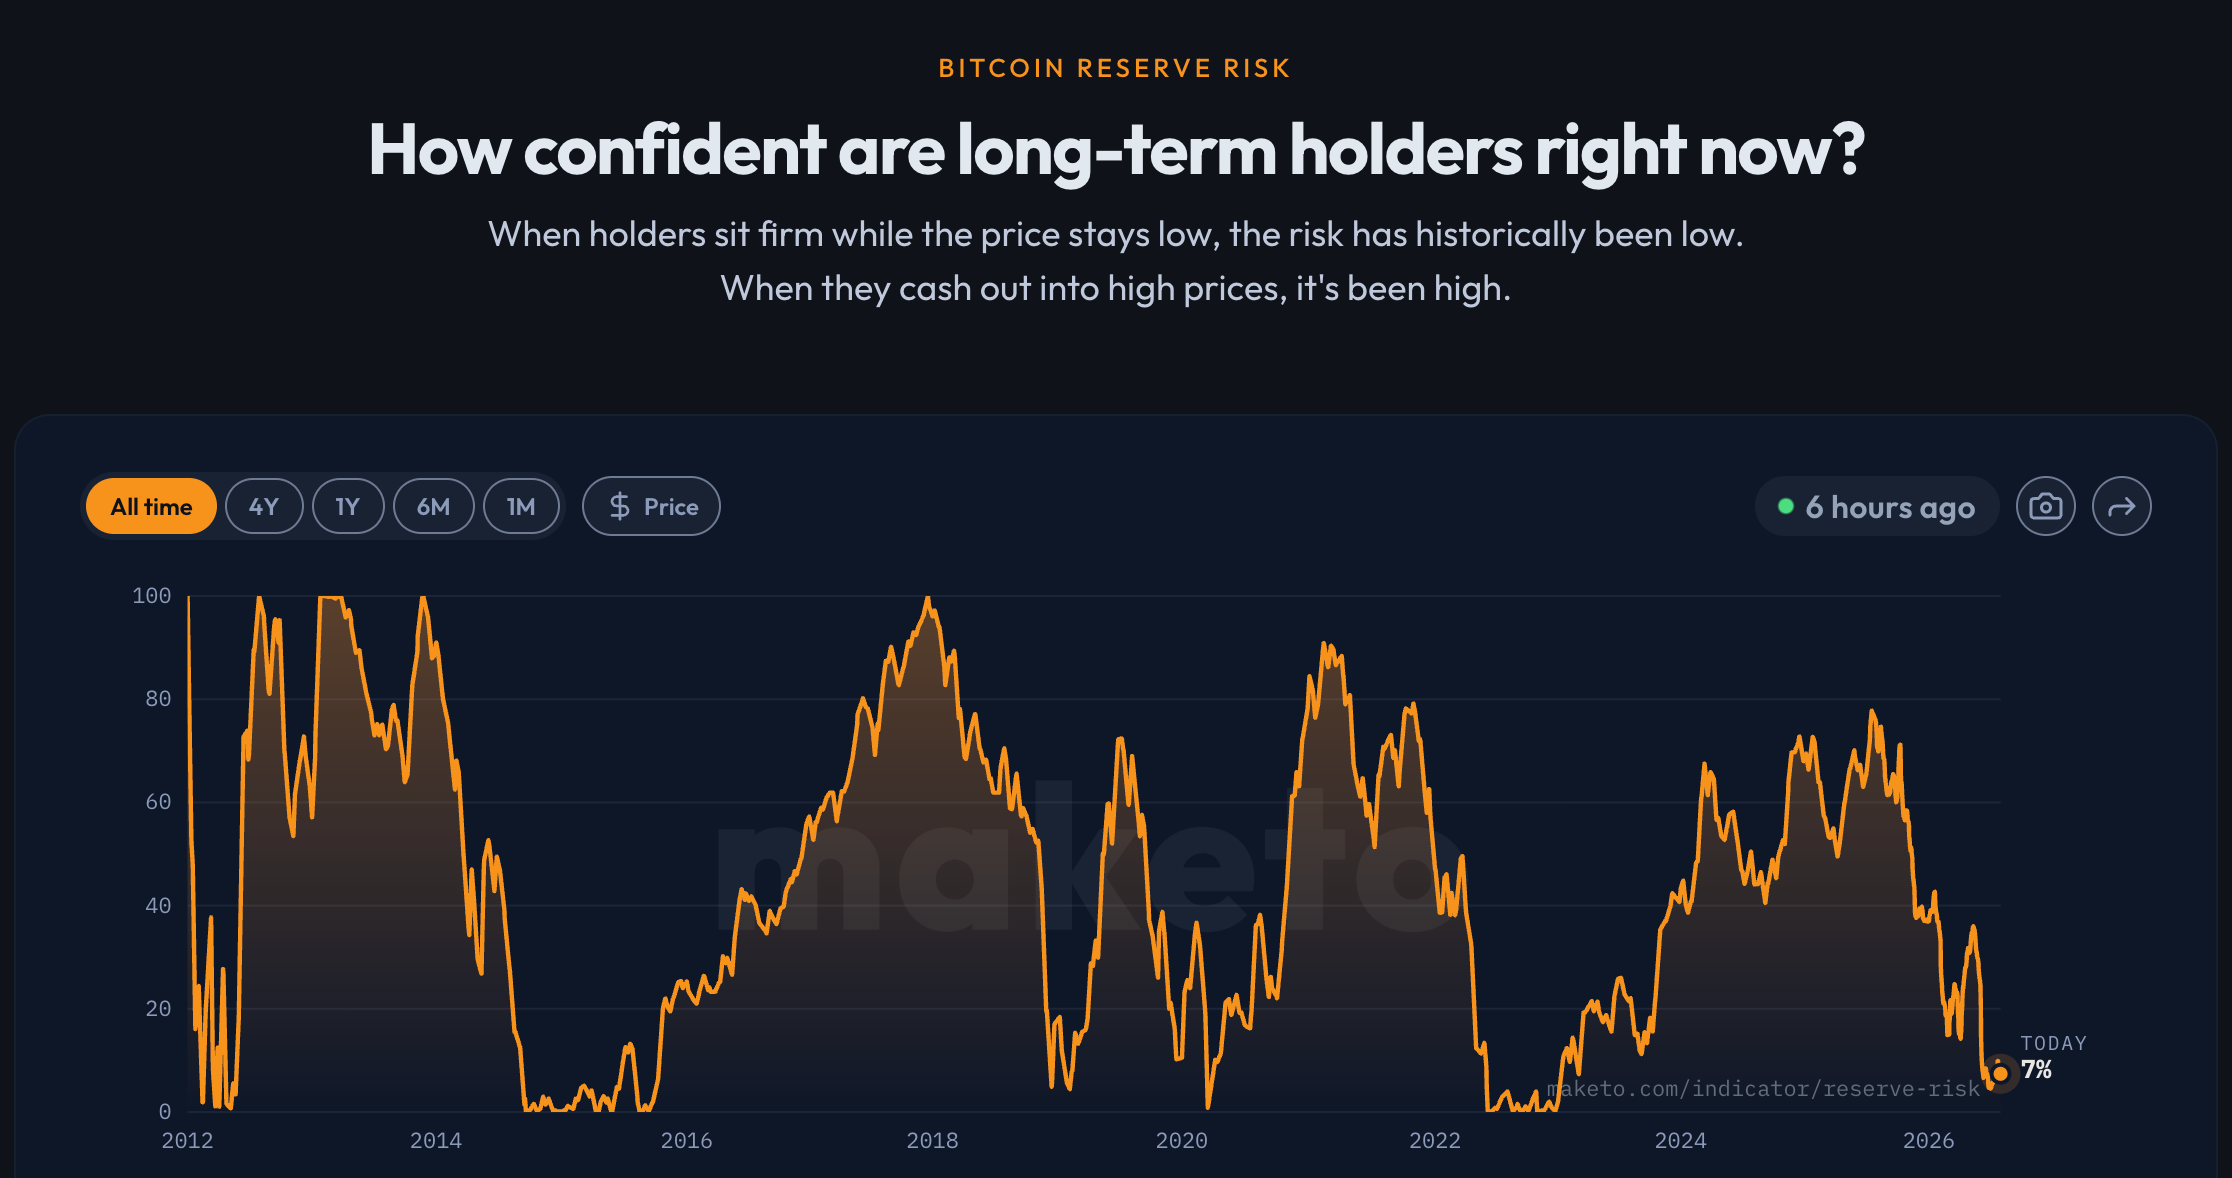
The behavior of Long-Term Holders (LTHs) provides another compelling line of evidence that the market is in the process of bottoming. Current Reserve Risk has dropped to approximately the 7th percentile of the past four years. This metric fundamentally quantifies the relationship between Bitcoin’s spot valuation and the conviction of its long-term holders: lower values typically indicate a diminished willingness among long-term holders to realize profits, signifying that market prices are deeply compressed relative to holder conviction. From this perspective, despite experiencing a severe drawdown, Bitcoin has not witnessed a wholesale exodus of long-term capital; instead, supply continues to be locked up in low-turnover accounts.
Source: https://maketo.com/indicator/reserve-risk
Overall, the market is currently exhibiting a classic pattern of bottoming divergence: miners are scaling back operations or liquidating assets under cash flow pressure, short-term holders are absorbing losses during drawdowns, while long-term holders continue to HODL. Capital and supply are gradually transferring from higher-cost, lower-conviction participants to longer-horizon capital. This process resembles a continuous supply-side cleansing rather than a synchronized capitulation event across all sellers at a single juncture. While this indicates that latent selling pressure is diminishing, it remains insufficient to confirm a trend reversal—supply contraction merely sets the stage for a bottom, whereas a genuine inflection point still requires fresh demand to seize pricing power.
3.4 Demand-side shows early signs of recovery, but sustained expansion has not formed
Ultimately, a structural bottom requires validation from the buy side. US spot BTC ETFs recorded a cumulative net inflow of approximately $172.6 million over the first 19 trading days of July 2026, comprising 11 days of net inflows against 8 days of net outflows. While capital flow rebounded mid-month, a consecutive string of net outflows ensued on July 23, 24, 27, and 28. This pattern indicates that while institutional capital has initiated low-level allocations, positioning remains hesitant and choppy, falling short of the sustained, unidirectional inflows characteristic of a full-fledged bull phase.
Stablecoins are similarly sending mixed signals. Total stablecoin supply peaked at approximately $320.4 billion in May 2026 before receding to roughly $306.5 billion by late July. As the primary settlement currency and dry powder reserved as "cash positions" in crypto markets, a declining supply indicates that capital is exiting the on-chain ecosystem or being redeemed, confirming that the macro demand base has yet to fully recover. Nonetheless, aggregate stablecoin market capitalization remains substantially higher than in previous bear market cycles. This suggests that non-speculative use cases—such as payments, cross-border settlement, and on-chain treasury management—have established a structural demand floor that goes well beyond pure trading activity.
In late July, significant BTC trading volume clustered between $63,200 and $67,000, establishing a dense cost-basis support band on-chain near $62,400 to $64,300. Conversely, overhead cost pressure remains prominent in the $81,400–$85,000 range. A decisive breach above this resistance zone, accompanied by concurrent growth in Realized Cap, ETF inflows, and stablecoin supply, is required to confirm that fresh capital is displacing internal churn and driving the next trend expansion.
In general, Bitcoin exhibits multiple classic signatures of a late-stage bear market: valuations have reset to depressed levels, miners and short-term holders are facing acute pressure, long-term capital continues to lock up supply, and spot ETFs have shown periodic inflow rebounds. However, these signals primarily reflect the waning of sell-side pressure rather than the inception of a new uptrend. Stablecoin supply expansion remains dormant, institutional inflows are still intermittent, and overhead supply resistance has yet to be convincingly broken. Consequently, the current regime is more accurately classified as a "Bottom Formation Phase" rather than a "Bottom Confirmation Point." While the market is approaching a critical confluence of valuation and holder conviction, a genuine structural trend reversal still demands sustained fresh liquidity to displace internal market churn.
-
Navigating the Deleveraging Cycle: Platform Competition Pivots to Comprehensive Operational Excellence
Exiters expose the industry’s systemic flaws, while survivors define the competitive rules for the next cycle. In a bear market, platform resilience can no longer rely on legacy brand equity or reported trading volumes. True cycle-enduring capability hinges on three pillars: controlling fixed operational costs and tail risks, adapting product suites dynamically to shifting user demands, and sustaining a functional core flywheel of users, liquidity, and revenues even amidst market doldrums.
4.1 Structural moats redefined: The convergence of liquidity depth, trust, and execution speed
In past cycles, mid-and-small exchanges could rely on rapid token listings and high rebate incentives to acquire users. However, accommodating a broader asset universe inevitably entails higher overhead across wallet infrastructure, risk management, market-making, and regulatory compliance. When long-tail assets lack organic volume, aggressive listings inadvertently induce liquidity fragmentation. The competitive paradigm has shifted from mere "feature coverage" to the "consistent end-to-end delivery of integrated services": spot markets require order book depth and rigorous curation; derivatives demand robust mark prices, insurance funds, and liquidation engines; global expansion hinges on local fiat gateways and compliance rails; and emerging asset classes require clear articulation of distinct rights and boundaries across Memes, AI tokens, Pre-IPO equities, and TradFi instruments.
From an operational perspective, platforms must pass four acid tests: First, core trading pairs must maintain authentic order book depth during extreme market stress. Second, user asset segregation, reserve transparency, and withdrawal workflows must withstand severe liquidity stress. Third, new product rollouts must drive structural user retention and fee generation rather than merely manufacturing one-off trading volume. Fourth, compliance, security, and technology overhead must not cannibalize total revenue. The bear market brings all four capabilities into sharp relief, making it increasingly difficult to sustain growth via subsidies or aggressive long-tail token listings alone.
Top-tier CEXs leverage scale and comprehensive product suites to compound their advantages; on-chain platforms capture high-value users through transparency and self-custody; whereas mid-sized platforms are forced to carve out differentiated entry points. No single moat remains perpetually defensible: low fee structures will be replicated, listing velocities matched, and product innovations commoditized into industry standards. Ultimately, the survivors are those possessing enduring operational resilience and robust risk management capabilities.
4.2 Product expansion must align with demand, not mask risks through hype-chasing
The current bear market is not devoid of new demand; rather, demand is highly concentrated in sectors that still command mindshare: Memes represent attention-based trading, AI captures macro technology narratives, and TradFi products bridge US equities, ETFs, and pre-IPO expectations into 24/7 crypto markets. However, if platforms merely chase narrative hype without elucidating the underlying substance of these products, they will inevitably accumulate compounding regulatory and counterparty risks.
For instance, stock tokens, equity perpetuals, and pre-IPO contracts may all reference the same corporate name or equity asset, yet the underlying rights conferred to the user differ fundamentally. While the former may represent tokenized economic exposure issued by the platform, perpetual contracts merely track price action, and pre-IPO products often incorporate valuation assumptions and listing milestone expectations. The true capability of a platform adapting to the TradFi trend lies not in rapid deployment, but in transparently defining price sources, trading schedules, underlying rights, liquidation mechanisms, and risk boundaries.
Furthermore, AI and Meme products should not be evaluated solely by short-term trading volume; platforms must rigorously assess community persistence, token concentration, authentic market depth, and exit mechanisms. Innovation during a bear market should serve to enhance revenue and structural retention, rather than leveraging high-volatility assets to delay the reckoning of underlying operational vulnerabilities.
4.3 Hotcoin case study: how prudent operations and product agility forge cyclical resilience
Founded in 2017, Hotcoin has operated steadily for nine years through 2026, successfully navigating multiple bull-bear cycles, liquidity contractions, and industry flushouts with zero major security incidents to date. Its service footprint now spans 183 countries and regions, serving over 7.3 million registered users. In full-year 2025, its spot and derivatives trading volumes reached $710 billion and $9.32 trillion, respectively. Third-party data provides additional windows into its asset transparency: as of July 30, 2026, CoinMarketCap’s "Financial Reserves" page indicates that assets held in Hotcoin's public addresses total approximately $85.35 million, including roughly 768.34 BTC (valued at approximately $49.19 million at the time), with the remainder predominantly consisting of USDT, USDC, DAI, and ETH. Furthermore, Hotcoin ranks among the top 10 in RootData’s cryptocurrency exchange transparency leaderboard.
At the product level, another enduring capability demonstrated by Hotcoin is its swift responsiveness to shifting market demand. Amidst the frenzy for Memes and early on-chain assets, the platform launched an "Alpha Zone" alongside targeted trading campaigns; as the AI narrative gained momentum, it swiftly integrated high-potential, high-interest projects; and when capital began gravitating toward TradFi and on-chain securitization, it rapidly rolled out tokenized securities spot and perpetual contracts. Its product scope has progressively expanded from traditional crypto assets to Memes, AI, and global equity price exposure—reflecting not a mere pursuit of transient hype, but a dynamic recalibration of product supply aligned with user interests and capital flows. For a mid-sized exchange, true cycle-enduring capability lies in defending the core baseline through stable operations while executing timely product updates as the market pulse evolves.
Overall, the bear market has redefined the competitive standards for trading platforms: true barriers to entry are no longer metrics of listing volume or ephemeral trading activity, but rather the cumulative synthesis of liquidity depth, security trust, risk management, and product responsiveness. Hotcoin’s nine-year operational track record demonstrates that a platform must safeguard its foundational baseline through stable systems and security mechanisms while simultaneously adapting its product offerings to shifting market demand. Only when activity translates into genuine users, sustainable revenue, and long-term retention does it achieve true commercial value. Ultimately, those capable of navigating the deleveraging cycle are not necessarily the fastest chasers of transient hype, but operators who can capture the market pulse without breaching risk boundaries—a discipline that will ultimately determine whether capital is willing to reprice these survivors when the cycle turns.
-
Outlook and Conclusion: Accelerated Exit of Legacy Supply, Awaiting Demand to Drive the Next Cycle
Having navigated price declines, commercial shakeouts, and the restructuring of platform competition, the market's fundamental inquiry has shifted from "who else will exit" to "what signals confirm the inception of a new cycle." A bear market bottom is not defined by a single price point, an isolated on-chain metric, or a specific shutdown count; rather, it is a gradual process driven by the simultaneous convergence of supply contraction, valuation reset, selling pressure exhaustion, and the relay of new demand.
5.1 Outlook: The market will pivot from indiscriminate cleansing to selective repair
The current market is leaning closer to the late stage of the bear market or the bottoming phase, during which the valuation and business bubbles accumulated in the previous cycle have been substantially squeezed. However, stablecoin supply has yet to resume expansion, ETF capital inflows remain volatile, and overhead underwater positions alongside macroeconomic liquidity pressures persist. Over the near-to-medium term, the market is more likely to complete low-range handshaking through recurring volatility—during which sharp rebounds are entirely plausible, while a retest of previous lows cannot be ruled out.
Cycle turning points require the joint confirmation of price action, capital flows, and chip structures. BTC must not only break through key cost bases, but also sustain its position and establish higher lows; ETF and spot capital flows must transition from intermittent inflows to continuous net accumulation, accompanied by a re-expansion of stablecoin supply. During the upward trajectory, funding rates and open interest (OI) must remain disciplined to prevent the premature re-accumulation of leverage at low levels. The most definitive signal, however, is when prices cease to make new lows despite ongoing platform shutdowns, security incidents, or macro headwinds—signaling that seller exhaustion has set in and that incremental buyers are seizing pricing power.
The next phase of recovery will not manifest as a synchronized rally across all assets, but rather as a rigorous re-filtering of value by capital. Liquidity will continue to concentrate toward tier-one platforms and premium assets, while financing will place a heavier premium on real users, revenue-generating capacity, and distribution channels. Sectors capable of connecting with tangible demand—such as stablecoins, payments, RWAs, AI, and TradFi—are likely to attract capital reflows first, whereas infrastructure dependent on subsidies devoid of user adoption and long-tail tokens will continue to phase out. A true cycle turn is defined not by the cessation of project bankruptcies, but by the market beginning to re-reward survivors capable of generating sustainable revenue and managing risk.
5.2 Epilogue: The old cycle ends with purging, the new cycle begins with demand
The successive exits of AscendEX, BitMEX, and BitMart, coupled with over a hundred projects being flagged for shutdown or cessation of operations, illustrate that the current bear market has transmitted far beyond asset price declines into exchange revenues, project financing, team sizing, and industry supply structures. History, scale, and market position no longer serve as natural safety cushions; platforms and projects devoid of sustainable cash flows, user retention, and risk management capabilities are being forced away from the table.
However, the wave of shutdowns cannot be deployed as a straightforward bottom-fishing indicator. Regulatory pressure, liquidity depletion, product failures, security incidents, and proactive migration are fundamentally distinct in nature and do not clear within the same timeframe. While current valuations have entered low ranges, long-term holdings remain stable, and institutional capital has shown intermittent reflows—signals that indicate the gradual accumulation of bottom conditions—they remain insufficient to prove that a definitive trend reversal has occurred.
A true inflection point will not be heralded by the closure of the last remaining exchange. It is more likely to manifest during a phase where adverse news continues to emerge, yet prices cease to decline: leverage remains disciplined, spot capital steadily absorbs circulating tokens, and capital ceases to bankroll every speculative narrative, choosing instead to re-allocate toward platforms equipped with real users, revenue generation, and risk management capabilities. The end of the old cycle is accomplished through cleansing; the beginning of the new cycle must be validated by demand.
About Us
Hotcoin Research is the research and insights division of Hotcoin, dedicated to turning professional research into actionable investment insights.
Through Weekly Insights and In-Depth Research Reports, we help investors understand market trends, underlying dynamics, and emerging opportunities across the digital asset ecosystem. Our Elite Picks series combines AI-assisted screening with analyst-driven research to identify promising assets and help investors evaluate opportunities more efficiently.
Through regular livestreams, our research team provides timely analysis of market developments and major industry trends. We believe that informed decision-making and a long-term perspective can help investors navigate market cycles and capture lasting value in Web3.
Risk Warning
The cryptocurrency market is highly volatile, and investment inherently carries risk. We strongly recommend that investors fully understand these risks and invest within a strict risk management framework to protect their capital.
Website:https://www.hotcoin.com/en_US/learn/index/
X: x.com/HotcoinAcademy
Email: labs@hotcoin.com
Đề xuất đọc
Xem thêm
Hotcoin Research | How Long Can the DAT Flywheel Spin — Crypto Wealth Feast or Bubble Trap?
In-depth Research

Hotcoin Research | Rebrand or Reinvention? Inside MakerDAO’s Transformation into Sky
In-depth Research

Hotcoin Research | Play and Earn in Web3: MyShell Unveiled—The Disruptor of the AI Creator Economy
In-depth Research

Liên hệ dịch vụ
Service@hotcoin.com
Phản hồi sản phẩm
Product@hotcoin.com
Hợp tác kinh doanh
Business@hotcoin.com
Liên hệ pháp lý
Casecn@hotcoin.com
Về chúng tôi
Phục vụ
hỗ trợ
©2017-2026