Crypto Market Top and Bottom Signals: A Practical Handbook
Tops and bottoms in crypto are never decided by a single signal. They come from several on-chain metrics, market sentiment, and macro cycles resonating at once. A top usually appears when the market is extremely greedy, retail crowds pour in, and on-chain metrics enter historically extreme territory. A bottom generally comes with panic selling, coins moving from short-term holders to long-term holders, and key valuation metrics falling into undervalued territory. The 2025 to 2026 cycle, however, is going through a structural change: spot ETFs and institutional custody have made traditional on-chain metrics such as MVRV and NUPL go silent at the top, and the toolbox for spotting tops and bottoms is being redefined.
Top Signals: When the Market Turns Euphoric
Historical data shows that Bitcoin market tops are usually marked by the following signals together:
- On-chain valuation reaches an extreme zone
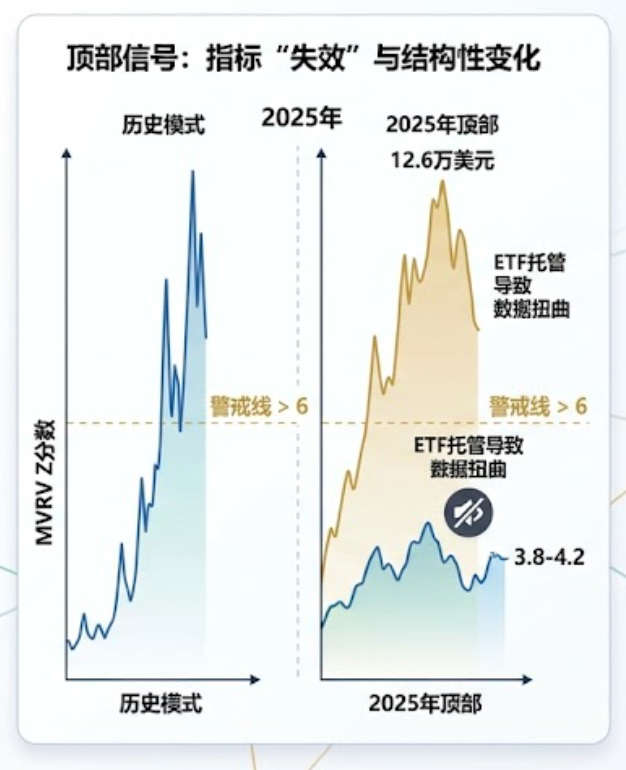
The classic MVRV Z-Score soared into the extreme zone above 5 to 10 in past bull markets, such as the tops of 2017 and 2021. That pattern broke in October 2025, when Bitcoin set a new all-time high of USD 126,000 but the MVRV Z-Score reached only about 3.8 to 4.2, far below the historical warning line. The MVRV Z-Score is calculated as (market cap − realized cap) / standard deviation of market cap. A reading above 6 usually marks a cycle top, and a reading below 0 marks a bottom.
NUPL (Net Unrealized Profit/Loss) broke above the 0.75 "euphoria zone" at the top of every previous cycle, and even approached 1.0 at the 2021 top. At the 2025 top, however, NUPL peaked at only 0.60 to 0.65 and never touched the euphoria zone.
- Retail and media euphoria
When crypto frequently appears on mainstream television, when celebrities and influencers endorse it en masse, and when social media discussion hits an all-time high, the market is usually overheated. In 2013, 2017, and 2021, this "mainstream mania" was typically followed by a bubble burst within two to three months.
- Institutionalization makes the metrics "break down"
The most important structural change of the 2025 to 2026 cycle is that ETF custody and institutional accumulation have stripped traditional on-chain metrics of their early-warning power. Billions of dollars of Bitcoin sit in custody wallets such as Coinbase Prime and never move on-chain, so metrics such as realized cap do not record them. ETF buyers replaced retail as the marginal buyer, while retail money was drained by meme coins and high-FDV VC tokens, which kept Bitcoin from entering a violent blow-off top.
Current data (August 2026): the MVRV Z-Score is around 0.9 to 1, a relatively moderate level, far from historical top territory.
Bottom Signals: When the Market Turns Desperate
Market bottoms usually come with widespread fear and a change of hands. The following are the core references for judging a bottom zone:
- On-chain valuation enters the undervalued zone
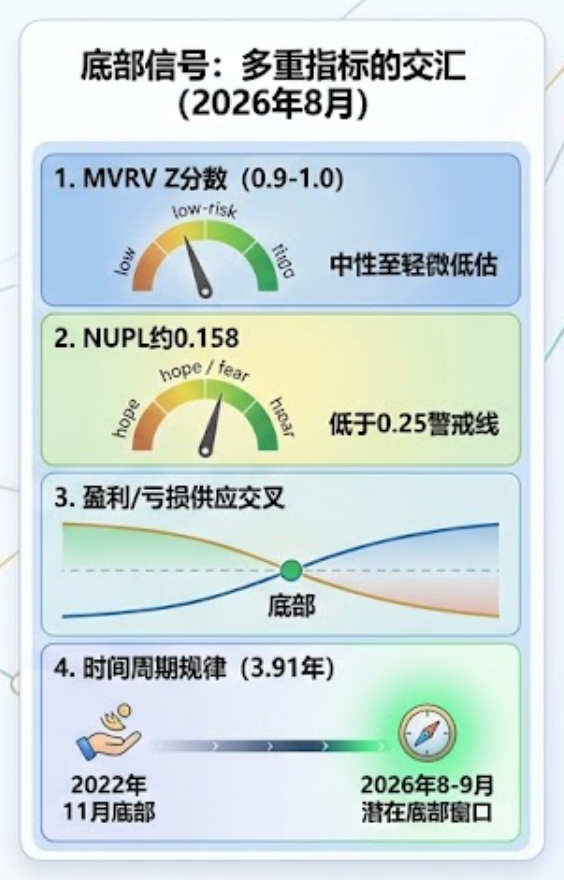
When the MVRV Z-Score falls below 0 or even turns negative, history has marked it as an excellent long-term buying opportunity, as at the bottoms of 2015, 2019, and 2022. When the BTC price falls below its realized price, that is usually seen as a severe undervaluation signal.
- The profit/loss supply crossover
The on-chain pattern analysts track shows that when the shares of Bitcoin supply in profit and in loss make a key crossover, it has repeatedly marked the end of a bear market. This crossover appeared at the cycle bottoms of both 2015 and 2019. The logic is that late in a downtrend new buyers are mostly underwater while long-term holders are still in profit, and the gap between the two shrinks until they converge.
- Risk index spikes
The BTC risk index measures the intensity of capital flows relative to Bitcoin's market cap. Counterintuitively, a spike signals low risk (opportunity), usually appearing when panic redistribution of coins happens during a sell-off, while a trough signals high risk (euphoria) and corresponds to a top where capital dries up. Every major historical spike has lined up with a cycle bottom: 2015 (after Mt. Gox), late 2018, March 2020 (the COVID crash), mid-2022 (Terra/Luna), and late 2022 (FTX).
- Coins move to long-term holders
A typical feature of the bottom phase is continued accumulation in whale wallets. At the 2022 bear market low (around USD 16,000), wallets holding more than 1,000 BTC bought heavily, which became a precursor to the reversal.
- Time cycle patterns
Looking at historical data, the interval between major Bitcoin cycle lows is about 3.91 years. The gaps between the three bottoms of January 2015, December 2018, and November 2022 are remarkably close. Counting forward from the November 2022 low, the next potential cycle low falls around August to September 2026. Institutional analysis points to a similar conclusion: the top came about 535 days after the halving (October 2025), and the bottom is expected about 18 to 24 months after the halving, that is, in the third to fourth quarter of 2026, especially October and November.
A Combined Bottom Framework (August 2026 View)
Several indicators are now showing a convergence of bottom characteristics:
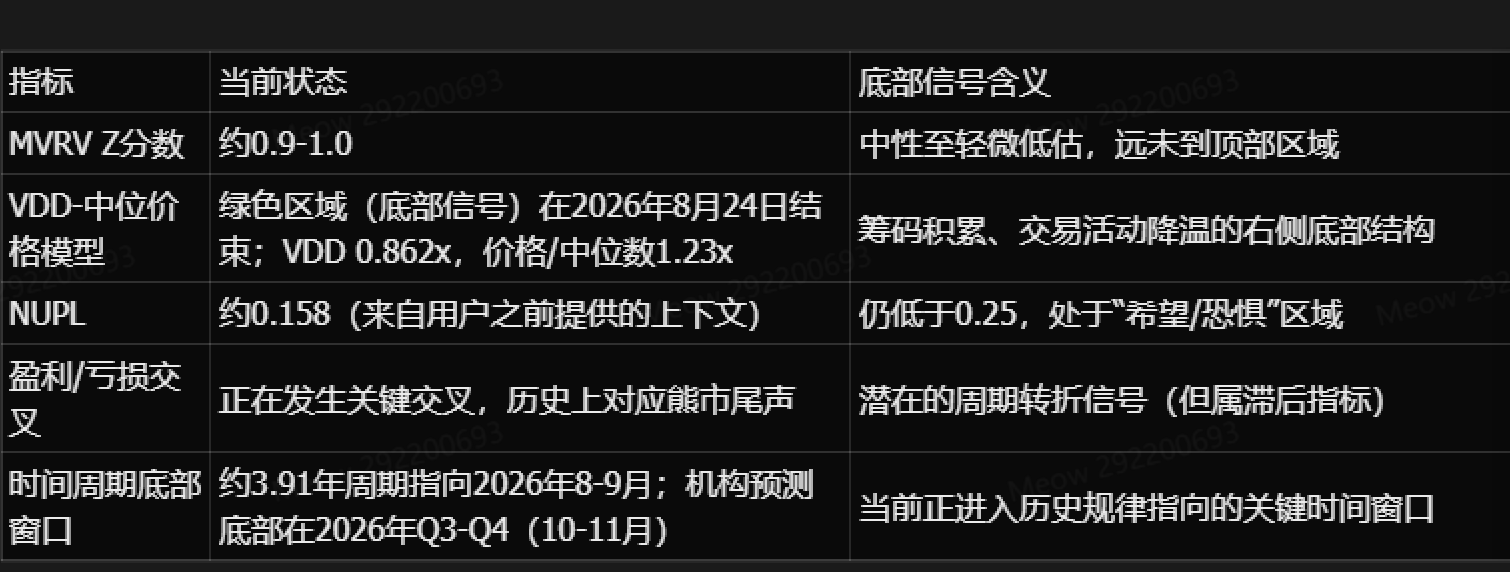

⚠️ Important reminder: what makes this cycle unusual is that traditional on-chain valuation metrics have already failed at the top, so the reliability of their bottom signals also needs to be re-examined. ETF custody artificially suppresses realized cap, which may cause MVRV and NUPL to understate true value, delaying or weakening bottom signals.
FAQ
Q1: What is the safe threshold for the MVRV Z-Score?
Historically, a Z-Score above 6 corresponds to the overheated top zone, below 0 or negative corresponds to the undervalued bottom zone, and 0 to 3 is a neutral to slightly undervalued range. In this cycle, however, institutional custody has distorted the data, so the historical thresholds may no longer apply.
Q2: What is the "profit/loss supply crossover," and why might it signal a bottom?
The metric tracks each Bitcoin's acquisition price against the current price: if the current price is above the acquisition price, that coin is "in profit," and if not, it is "in loss." Late in a downtrend, recent buyers are broadly underwater while long-term holders remain in profit, and the gap narrows until the proportions converge and cross. That crossover appeared at the cycle bottoms of both 2015 and 2019.
Q3: Why did traditional on-chain metrics go silent together at the 2025 top?
The core reason is a change in market structure: Bitcoin held under ETF and institutional custody has never moved on-chain since it was bought, so metrics such as realized cap do not record it. Billions of dollars are held through regulated custody channels, but on-chain metrics cannot see them. At the same time, retail money was drained by meme coins and VC tokens, so no euphoric trading emerged to trigger the traditional top signals.
Q4: Where is the market in its cycle right now?
As of late August 2026, Bitcoin is ranging between USD 75,000 and USD 81,000. Several bottom indicators (MVRV Z around 0.9 to 1.0, the green VDD bottom signal, and the profit/loss crossover) are converging, while the 3.91-year cycle pattern points to August and September 2026 as a potential bottom window. Note, however, that historical patterns are not absolute: if the macro economy deteriorates or regulation changes abruptly, a single indicator signal can fail.
Related tutorials:
Crypto Market Cycle Analysis: From Bull-Bear Transitions to Sector Rotation
On-Chain Data for Beginners: Exchange Inflows and Outflows, MVRV, and NUPL
Fear and Greed Index: A Quantitative Guide to Market Sentiment
Bitcoin Halving Cycle Explained: The Wealth Code of a Four-Year Rhythm
How Macro Economics Affects Crypto Markets: Rates, CPI, and Liquidity
Recommended reading:
Leitura recomendada
Veja mais