Golden Cross vs Death Cross: Moving Average Signals and Common Misconceptions Explained
When the news says Bitcoin has formed a "golden cross," it sounds like a big rally is about to begin. The next time you see a "death cross," it is easy to assume the market has no hope left. Both names are eye-catching, but the calculation behind them is simply a change in the relative position of two moving averages.
Crosses can help you observe trends, but they are not a promise from the market about future moves. To understand them, you first need to know which two lines are involved, which timeframe is used, and how far price has already moved before the cross occurs.
Key Takeaways
- A golden cross usually means a short-term moving average crosses above a long-term moving average; a death cross is the opposite.
- A common long-term observation pair is the 50-day and 200-day moving averages; other pairs should be clearly labeled.
- SMA and EMA are calculated differently, so even the same periods may cross at different times.
- Moving averages depend on historical prices, so signals lag and are especially prone to repeated crosses in ranging markets.
What Are Golden Crosses and Death Crosses?
Moving averages smooth prices over a period to help observe trend direction. Short-term averages follow recent prices more quickly, while long-term averages change more slowly. When the former crosses above the latter from below, it is usually called a golden cross; when it crosses below from above, it is usually called a death cross.
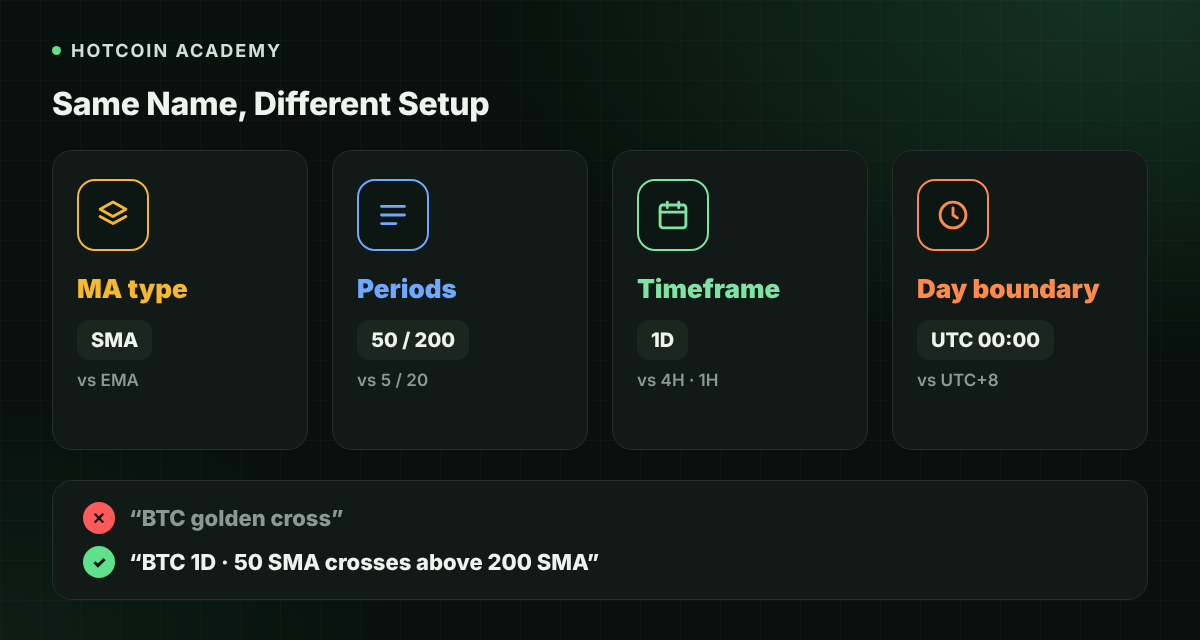
When discussing long-term market trends, people often use the 50-day and 200-day moving averages. The long-term examples in this article use daily SMA as the basis. If you switch to EMA, or to a 5-day and 20-day pair, the timing and meaning of the signals will change, and they should not be conflated.
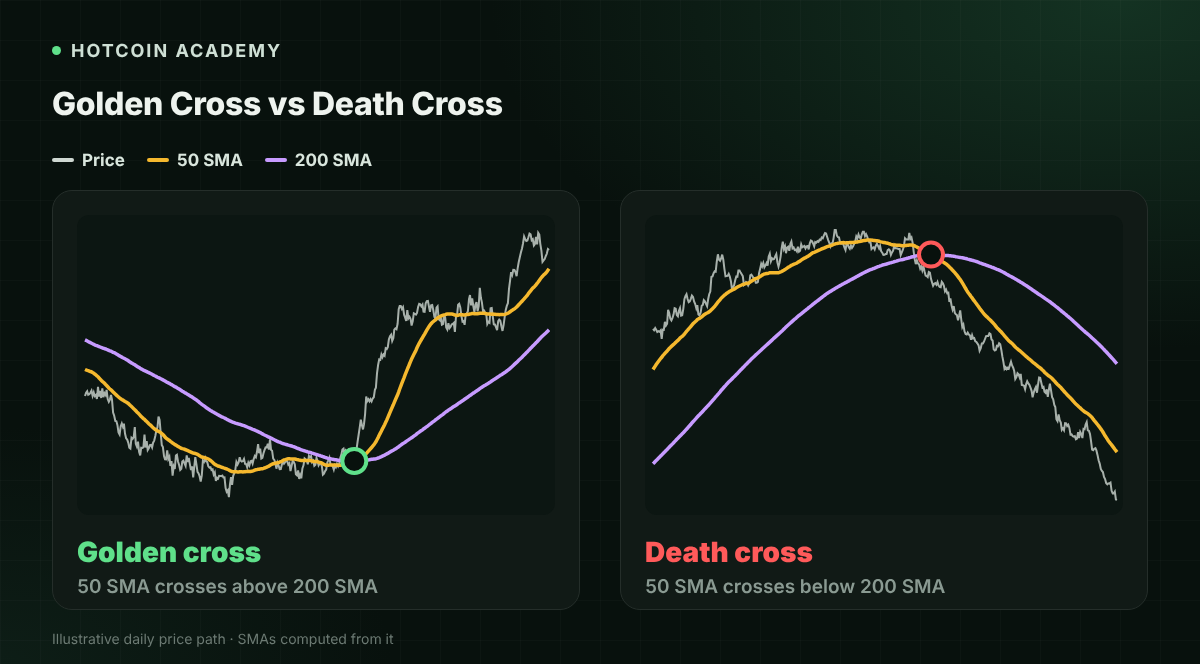
| Name | Formation condition | Usually used to observe | Cannot guarantee |
|---|---|---|---|
| Golden cross | Short MA crosses above long MA from below | Recent average price turning relatively stronger | Sustained rise afterward |
| Death cross | Short MA crosses below long MA from above | Recent average price turning relatively weaker | Sustained decline afterward |
What Is the Difference Between SMA and EMA?
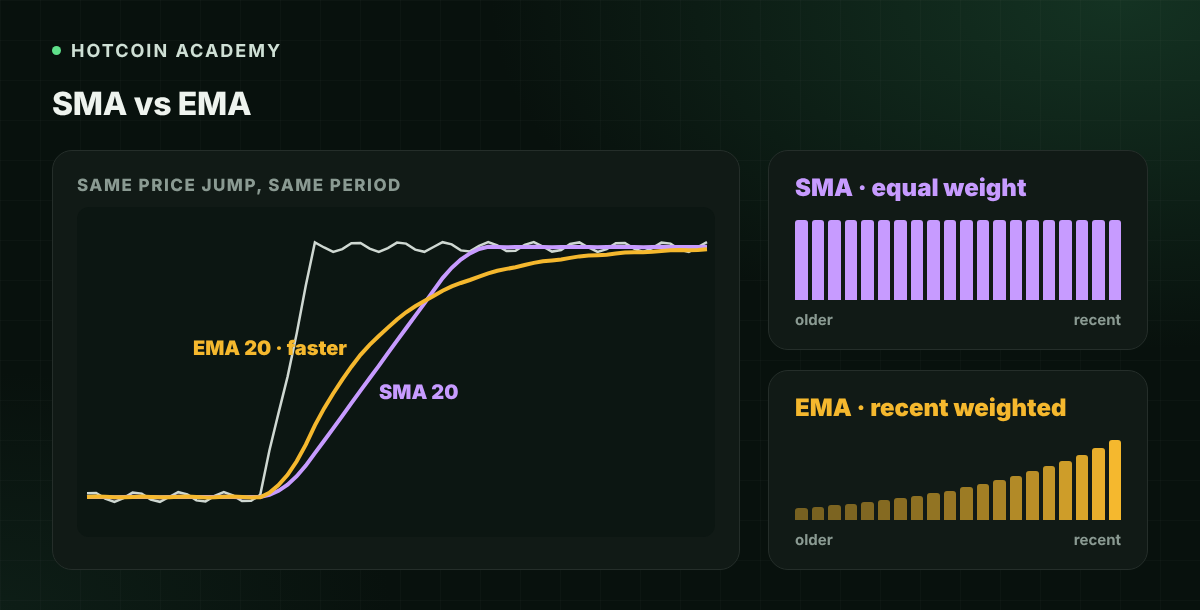
A simple moving average (SMA) gives equal weight to each price in the period; an exponential moving average (EMA) gives more weight to recent prices, so it usually reflects new changes faster.
For example, the 50-day SMA is the simple average of the closing prices of the most recent 50 daily candles. Each day a new closing price is added while the earliest value is removed. Even if the day's price change is small, an older price dropping out of the calculation can shift the moving average.
| Comparison item | SMA | EMA |
|---|---|---|
| Weighting | Equal weight across the period | Higher weight on recent prices |
| Reaction to new changes | Usually slower | Usually faster |
| Cross timing | May be later | May be earlier |
| Common limitation | Depends on historical data | Also depends on historical data |
So when two people disagree about whether the same coin has crossed, first check the moving-average type, price source, chart timeframe, and daily boundary time. There is no need to immediately conclude that one of them calculated it wrong.
Why Crosses Do Not Always Play Out as Expected
By the time a moving-average cross appears, recent prices have usually already moved for a while. Suppose price first rebounds clearly from a low, the 50-day MA gradually rises, and only later crosses the 200-day MA. The cross reflects changes that have already accumulated; it should not be treated as the exact moment the low just appeared.
Ranging markets present the opposite problem: price moves up and down repeatedly within a range, and the short MA may cross back and forth around the long MA. Each cross looks like a new trend, but in reality it is only range noise, and trading costs keep accumulating.
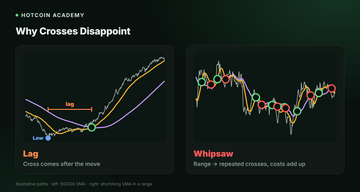
This is also why there is no universal answer to "what is the win rate of crosses" without conditions. You first need to define the asset, timeframe, entry and exit rules, statistical period, and costs before results can be compared.
How to Read Cross Signals in Crypto Markets
- Write down the setup clearly first. For example, "BTC daily, 50 SMA crosses above 200 SMA" is far more precise than "BTC had a golden cross."
- Look at the direction of the long MA. A cross above while the long MA is still clearly falling has a different context from one after the long MA has gradually flattened.
- Look at where price is. Whether price has broken an important range and how far it is from the moving averages both affect subsequent risk.
- Wait for the close of the timeframe you use. Price is still changing intraday, and the relevant cross may disappear before the close.
- Incorporate risk and trading costs. Define the conditions under which your judgment is invalidated first, rather than treating the next opposite cross as the only exit basis.
These steps provide a reading framework, not a buy or sell strategy. Volume and prices may also differ across trading platforms, so keep the data source consistent when reviewing history.
How Is a Moving-Average Cross Different from a MACD Golden Cross?
A moving-average golden cross compares two price moving averages. A MACD golden cross usually compares the MACD line with its signal line, and its calculation also involves the difference between fast and slow moving averages and smoothing. Both are related to historical prices, but they are not the same event.
A chart may show a MACD golden cross while the 50-day MA is still below the 200-day MA. This is not a contradiction; it only shows that different tools are describing changes at different levels.
Common Misconceptions
- "A golden cross means a bull market is starting immediately." Crosses may lag and may also occur during prolonged ranging.
- "There can be no rebound after a death cross." The moving-average relationship cannot rule out short-term rebounds, and a reverse cross may even appear soon after.
- "The shorter the timeframe, the easier it is to get ahead." Faster reactions usually also mean more noise and higher trading frequency.
FAQ
Q1: Is a golden cross always the 50-day and 200-day moving averages? This is a common long-term pair, but not every discussion uses it. You must confirm the author's specific setup when reading.
Q2: Is an EMA golden cross more accurate than an SMA golden cross? There is no universal conclusion. EMA adapts to prices faster, but that does not mean it delivers higher returns or lower risk in all markets.
Q3: What should I do if the daily golden cross and the hourly golden cross conflict? They reflect different time scales. Hourly changes cannot directly replace a judgment about the long-term trend.
Q4: Are moving-average crosses suitable for ranging markets? Crosses tend to repeat in ranges, and trend-following methods may suffer multiple small losses. This limitation must be recognized.
Q5: Does year-round trading in crypto affect moving averages? Yes. Crypto daily candles usually form one bar per day, unlike stock-market samples calculated by trading days, so cross-market comparisons need to account for the difference in basis.
Conclusion
Golden crosses and death crosses are both changes in the relative position of moving averages. The truly useful information comes from the price structure surrounding the cross, the timeframe used, and the trend context.
Risk warning: This article is for educational and informational purposes only and does not constitute investment advice. Historical cross performance cannot guarantee future results, and technical signals may lag or fail.
Leitura recomendada
Veja mais