Bitcoin Rainbow Chart: How to Read This Real-Time BTC Valuation Model
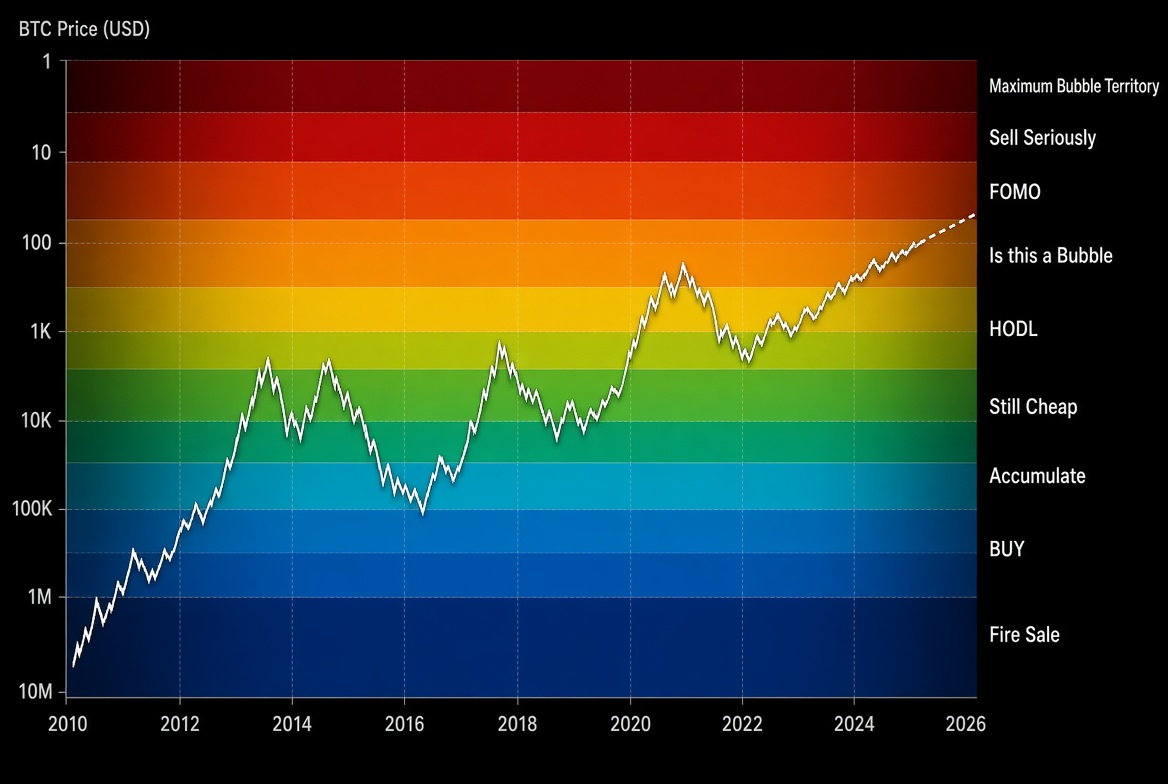
The Bitcoin Rainbow Chart is a long-term valuation model based on logarithmic regression. Its colored bands show whether BTC is historically undervalued, fairly valued, or overvalued, helping investors assess its position within a broader market cycle.
The chart plots Bitcoin's price history since 2010 on a logarithmic scale and uses colored bands to divide it into different sentiment and valuation zones. It does not predict short-term price movements. Instead, it provides a framework for answering: “Where are we along Bitcoin's overall growth trajectory?” The following sections explain how to understand and use the model in practice.
What Is the Bitcoin Rainbow Chart? Core Principles
The Rainbow Chart is built on a logarithmic regression curve. Bitcoin rose from a few cents to tens of thousands of dollars, so a linear scale compresses its early history until it is almost invisible. A logarithmic scale presents changes across different orders of magnitude more fairly.
The model fits a long-term trend line to the complete historical daily price series and divides the areas above and below it into nine colored bands at fixed proportions. Each band represents a different level of market sentiment and historical valuation:
Bottom dark blue/purple: Fire Sale / Bitcoin is Dead (extremely undervalued)
Blue: BUY!
Blue-green: Accumulate
Green: Still Cheap
Yellow-green: HODL!
Yellow: Is this a Bubble?
Orange: FOMO intensifies
Red-orange: Sell. Seriously, SELL!
Top dark red: Maximum Bubble Territory
As of August 2026, BTC is trading near $80,000, and most real-time versions place it in the Accumulate or Still Cheap band. Relative to its long-term trend, this suggests an undervalued or lower-end fair valuation.
How to View the Real-Time Bitcoin Rainbow Chart
Visit a specialist site such as BlockchainCenter, BTC.network, Bitcoin.com Charts, or Datawallet.
The page overlays the latest price on the colored bands in real time.
Check which band currently contains the price and review that band's historical upper and lower boundaries.
Switch between time ranges, such as the full history or individual halving cycles, to examine Bitcoin's cycle position.
Cross-check the reading with the Fear & Greed Index and on-chain data.
Most platforms update the price line almost instantly, while the regression curve changes more gradually as new data is added.
How to Use the Rainbow Chart for Decisions
The Rainbow Chart works best as a cycle-positioning tool, not as a precise buy or sell signal. A practical framework is:
Blue and green bands: Historically, these have often been long-term accumulation zones. Dollar-cost averaging or gradual position building may be considered when fundamentals and the macro environment are supportive.
Yellow bands: The market is approaching or entering fair value. Holding may take priority over aggressive buying.
Orange and red bands: These indicate overheated sentiment and potential overvaluation. Historically, they have often appeared near cycle peaks, making profit-taking discipline and position management especially important.
Rapid movement across bands: This often comes with high volatility and should be evaluated alongside trading volume and macro events.
Common failure scenarios should also be considered. Because the model is fitted to historical data, it cannot anticipate major regulatory changes, technological breakthroughs, or macroeconomic black swans. As Bitcoin's market capitalization and institutional participation grow, historical bubble heights may also become less applicable.
How This Guide Adds Context Beyond Leading Results
Many pages show only the chart and a short explanation of its colors, without a complete usage framework or limitations. This guide adds:
A clear explanation of the calculation logic and band meanings.
Practical viewing steps and a usable decision sequence.
Common failure conditions and cross-validation suggestions.
Use Cases and Risk Warning
Long-term dollar-cost averagers: Increase the pace of regular purchases in blue or green bands and slow down in red bands.
Cycle observers: Use the chart to assess whether the market may be in an early, middle, or late bull-market phase.
Risk warning: The Rainbow Chart is only a visualization of historical statistics and does not constitute investment advice. Past performance does not guarantee future results. Consider your own risk tolerance and pay attention to platform security and regulatory requirements.
Frequently Asked Questions
Q1: Which band does the Bitcoin Rainbow Chart show for BTC today?
A: Most real-time versions currently place the price in the Accumulate or Still Cheap band. Check a specialist chart directly for the latest reading.
Q2: Can the Rainbow Chart identify exact market bottoms or tops?
A: No. It provides a long-term relative valuation reference and cannot predict exact short-term tops or bottoms. Other indicators and risk-management practices are still required.
Q3: Do the Rainbow Chart's colored bands change over time?
A: Yes. The regression curve adjusts gradually as new price data is added, and the band boundaries move with it. Different websites may also use slightly different versions.
Q4: Why use a logarithmic scale instead of a standard scale?
A: Bitcoin's price spans several orders of magnitude. A standard scale makes its early history almost invisible, while a logarithmic scale presents its long-term growth path more fairly.
Q5: How does the Rainbow Chart differ from the Fear & Greed Index?
A: The Fear & Greed Index reflects short-term sentiment and updates frequently. The Rainbow Chart shows long-term valuation positioning and is better suited to cycle analysis. The two tools can complement each other.
With this framework, users can understand and apply the Bitcoin Rainbow Chart as a real-time BTC valuation model. Consider adding it to a long-term monitoring toolkit alongside price data, on-chain metrics, and sentiment indicators. Market cycles are long, and an objective, patient approach is more sustainable over time.
Leitura recomendada
Veja mais