
What Is the Difference Between Arithmetic and Geometric Grids?
An arithmetic grid uses a fixed price difference between levels, while a geometric grid uses a fixed price ratio. An arithmetic grid is often easier to understand when the range is narrow and you want intuitive order prices. A geometric grid is usually more suitable when the range is wider and you want the percentage change between grid levels to remain similar.
The Key Difference Between Arithmetic and Geometric Grids
An arithmetic grid divides the range between the highest and lowest prices evenly, so adjacent levels always differ by the same amount. A geometric grid calculates each level using a fixed ratio. Its absolute spacing is smaller at lower prices and gradually widens at higher prices, while the percentage change represented by each grid remains broadly consistent.
The general arithmetic-grid formula is:
Grid spacing = (Highest price − Lowest price) ÷ Number of grids
The general geometric-grid formula is:
Grid ratio = (Highest price ÷ Lowest price)^(1 ÷ Number of grids)
The number of grids usually represents how many segments the price range is divided into. Setting five grids creates the lowest price, four intermediate prices, and the highest price, for a total of six price levels. Interface definitions may differ between platforms, so check the relevant product documentation when configuring a strategy.
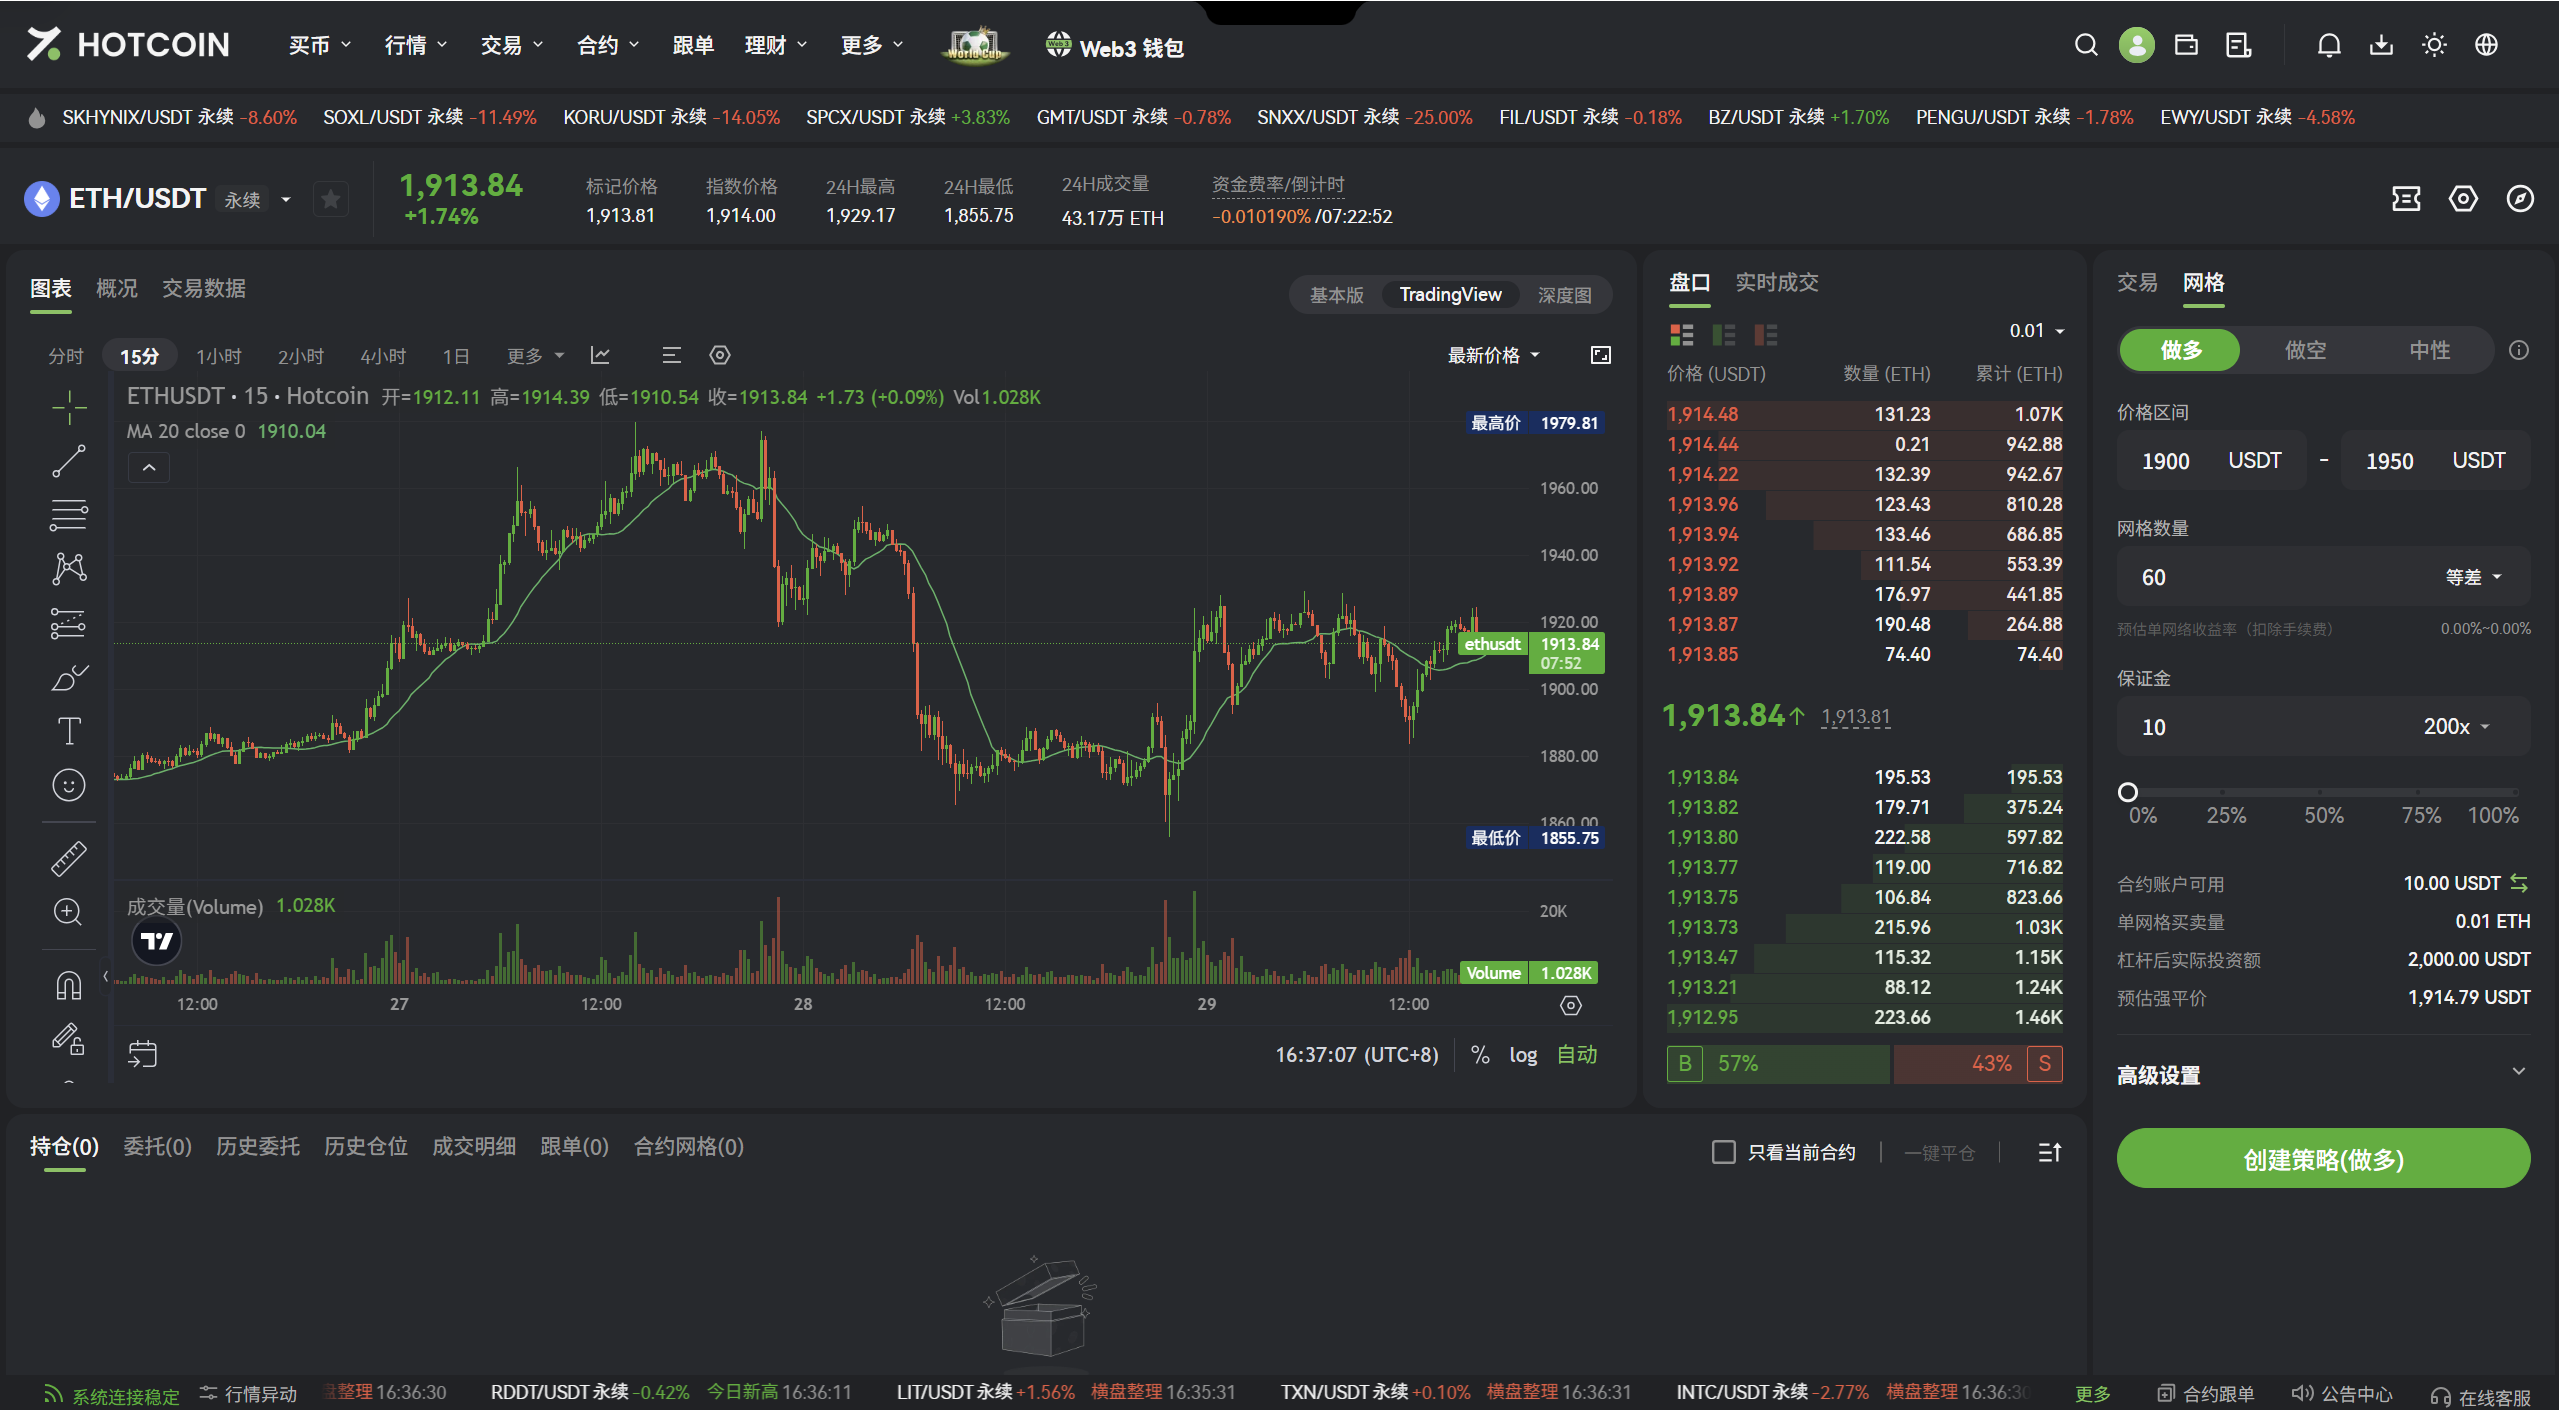
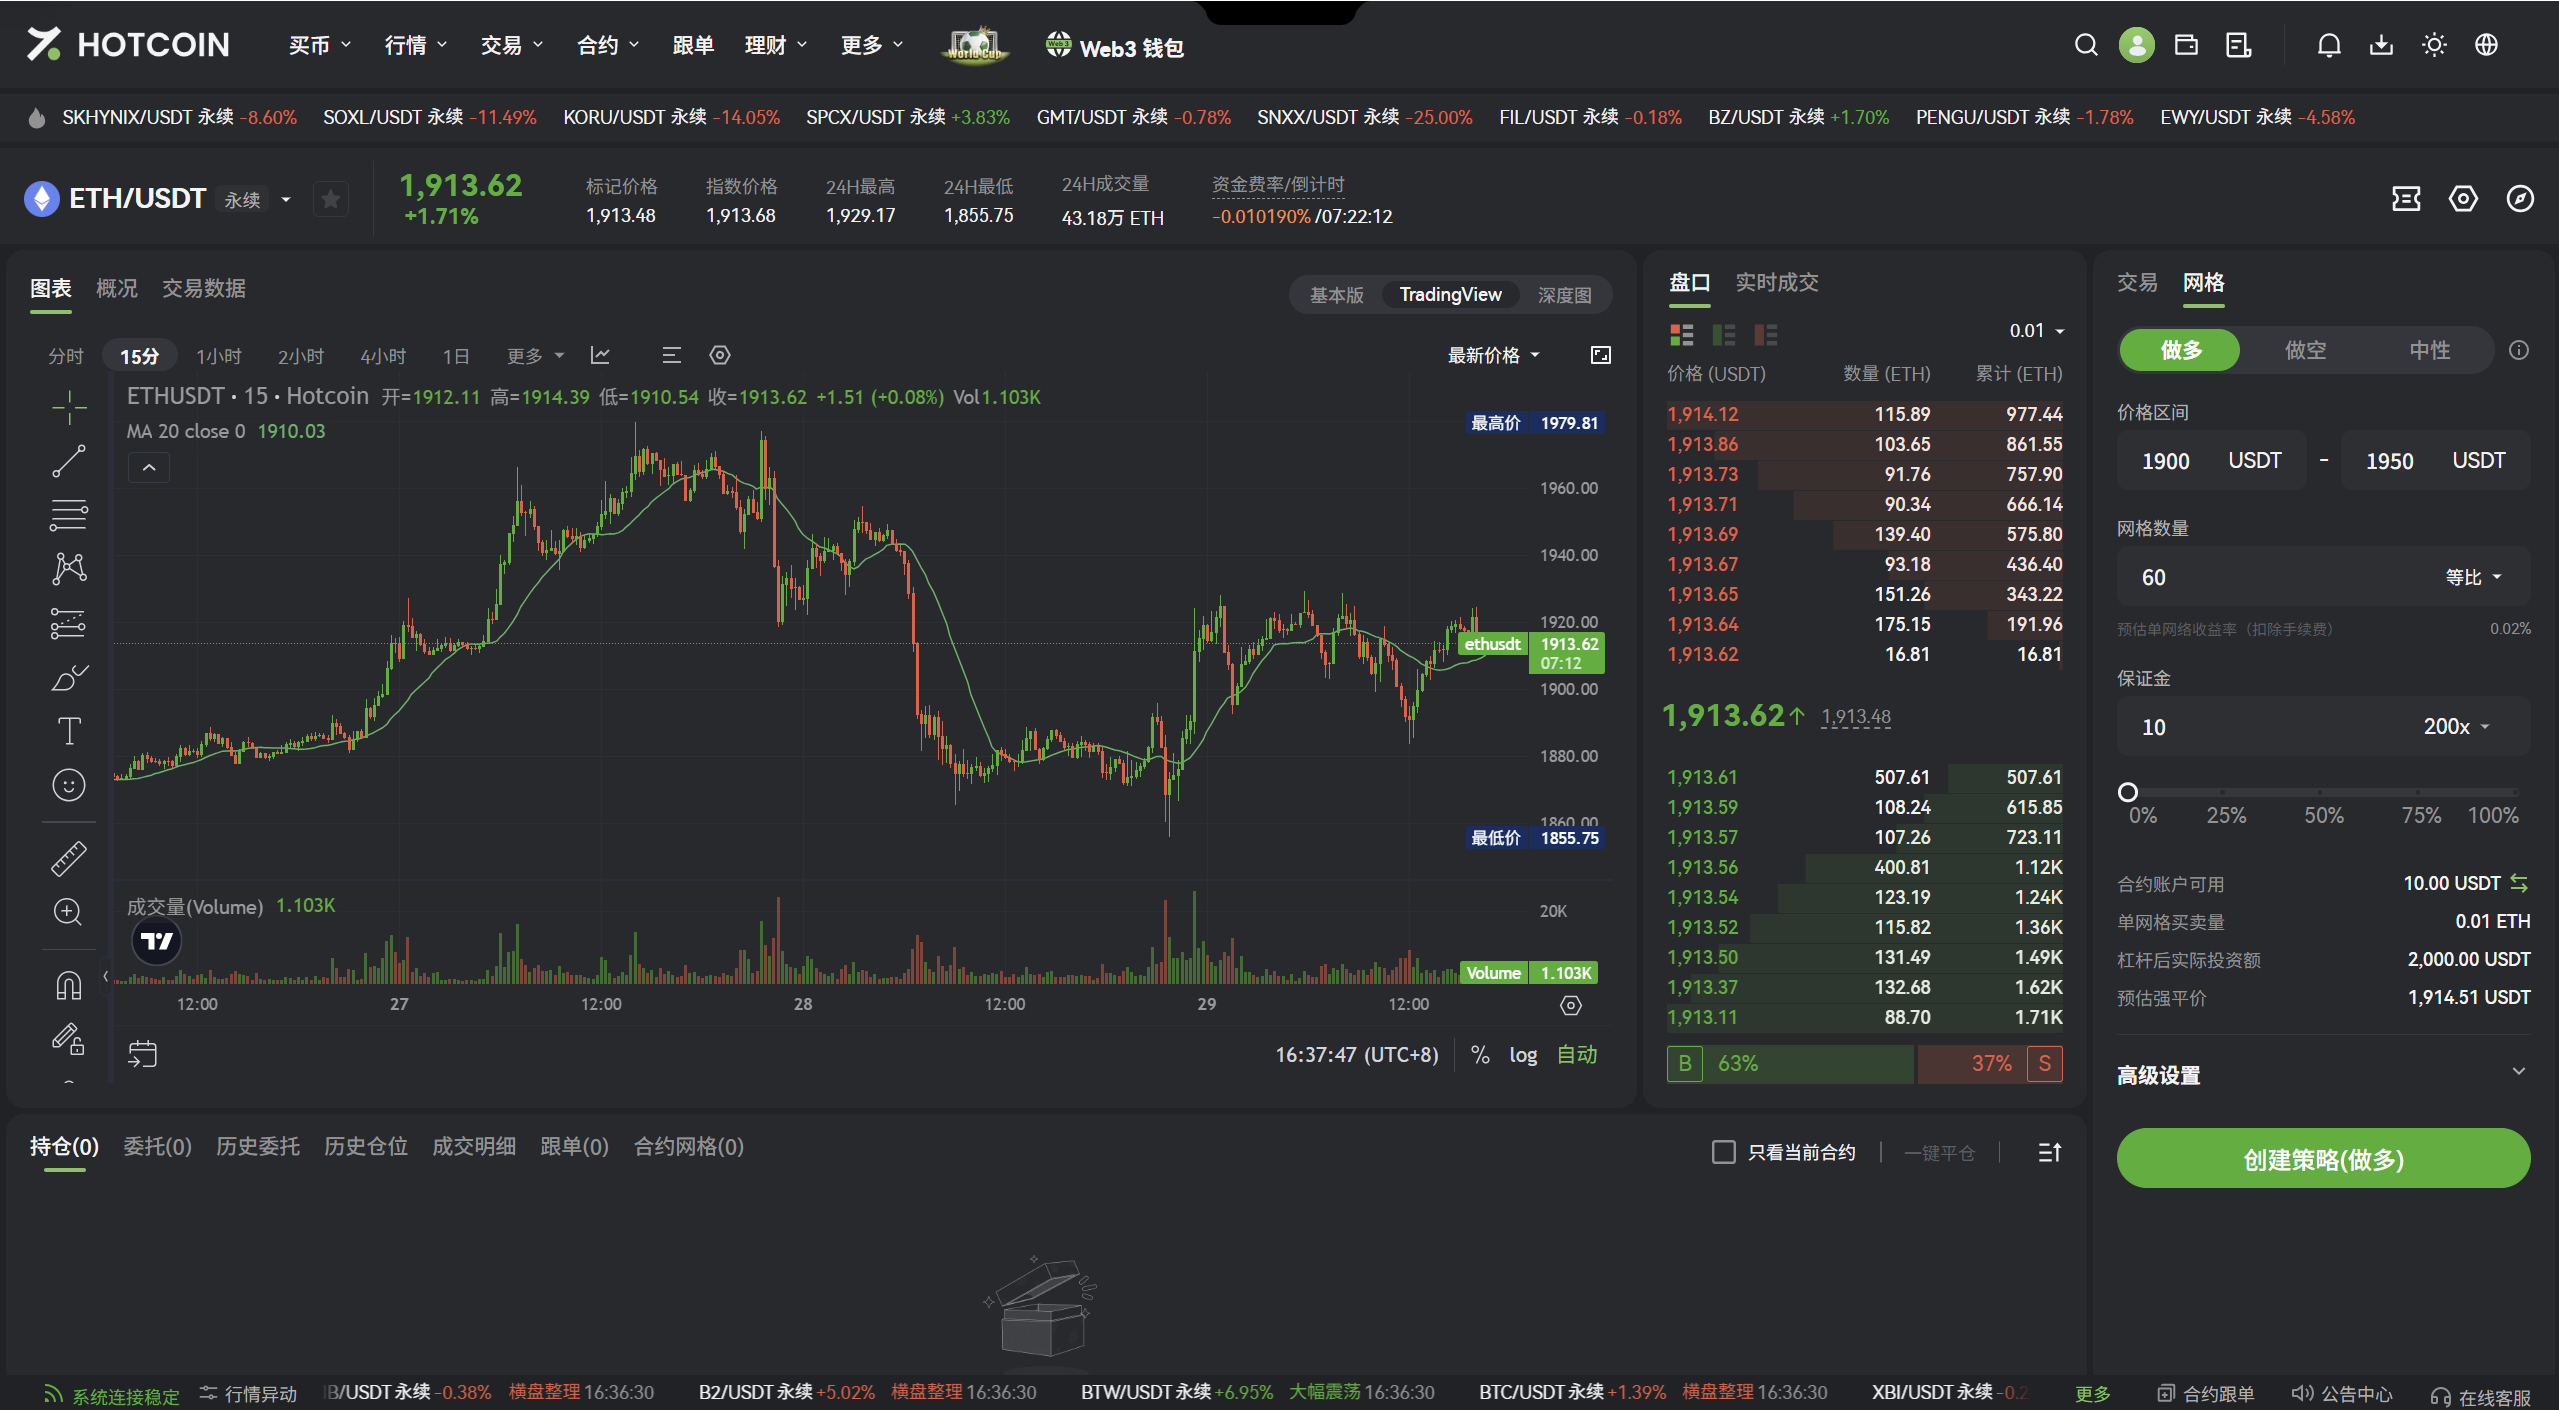

Comparing Price Levels With the Same Hotcoin Parameters
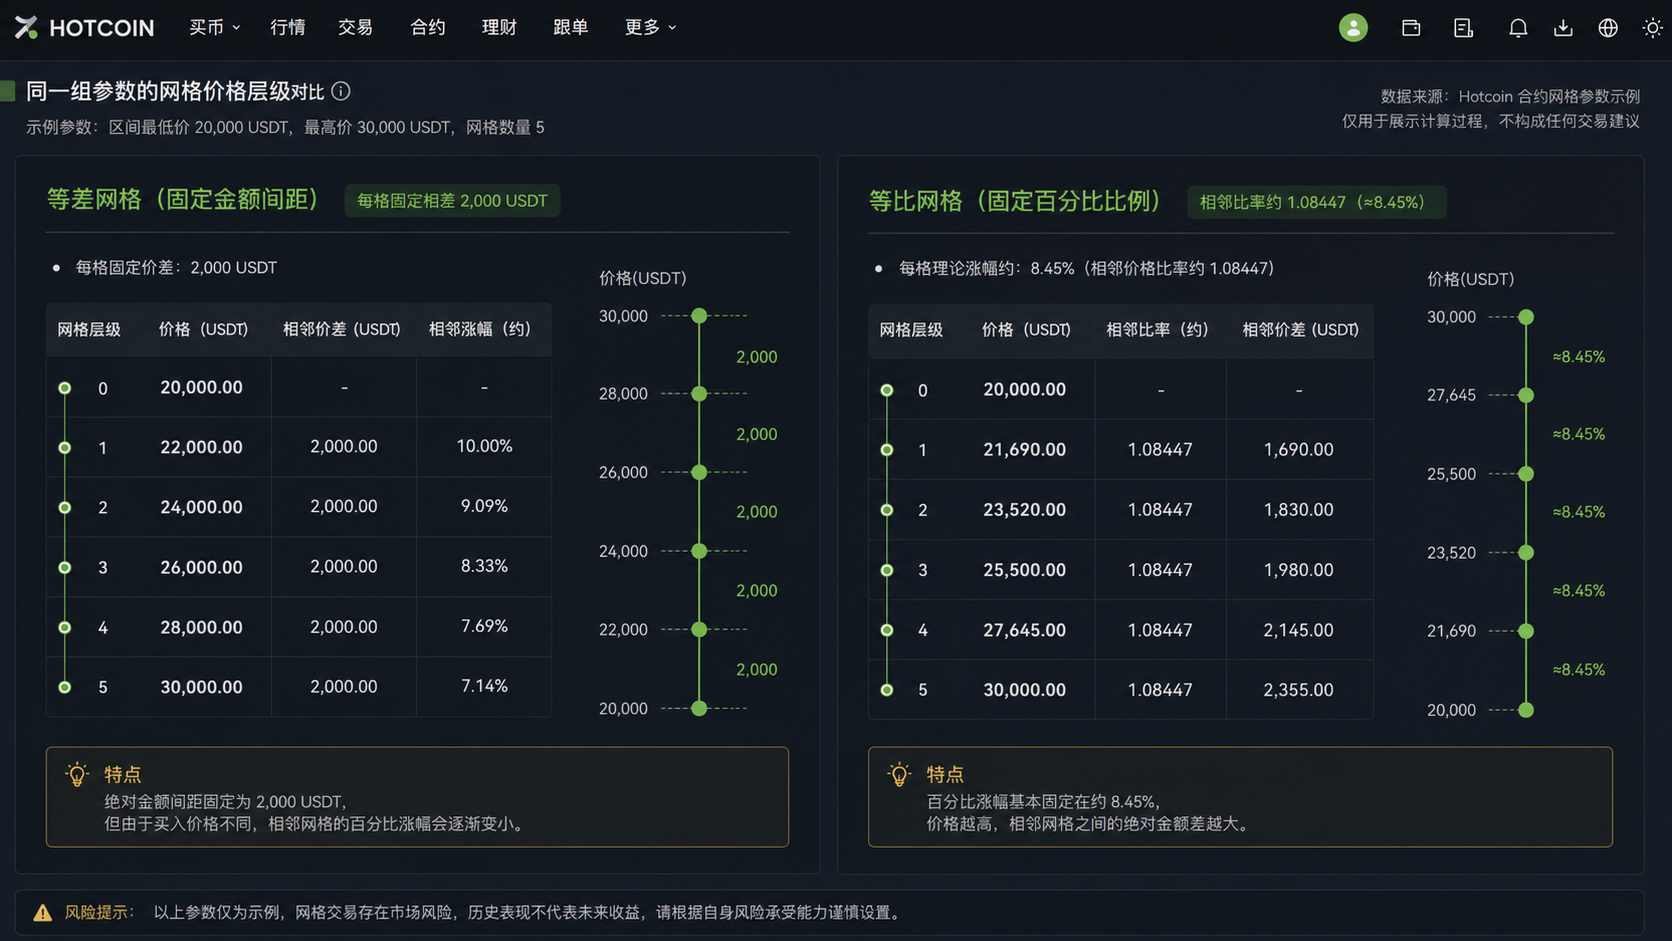
Hotcoin's futures grid parameter guide provides a reproducible example: a lower boundary of 20,000 USDT, an upper boundary of 30,000 USDT, and five grids. In arithmetic mode, each grid differs by a fixed 2,000 USDT, producing price levels of 20,000, 22,000, 24,000, 26,000, 28,000, and 30,000 USDT.
In geometric mode, the ratio between adjacent prices is about 1.08447, equivalent to a theoretical increase of roughly 8.45% per grid. After accounting for the trading pair's minimum price increment, the Hotcoin example uses price levels of 20,000, 21,690, 23,520, 25,500, 27,645, and 30,000 USDT.
These figures show that the arithmetic grid maintains a fixed 2,000 USDT price difference across the range, but the percentage represented by that same 2,000 USDT differs at each entry price. For example, a rise from 20,000 to 22,000 is 10%, while a rise from 28,000 to 30,000 is about 7.14%.
The geometric grid works in the opposite way. It prioritizes keeping the theoretical percentage change per grid consistent, so the absolute difference between adjacent levels increases as the price rises. Actual prices are also subject to the trading pair's minimum quote increment, and the platform may round the theoretical results.
These figures come from Hotcoin's official parameter example. They illustrate the calculation process only and do not represent BTC's current price, a recommended range, or an expected market direction.
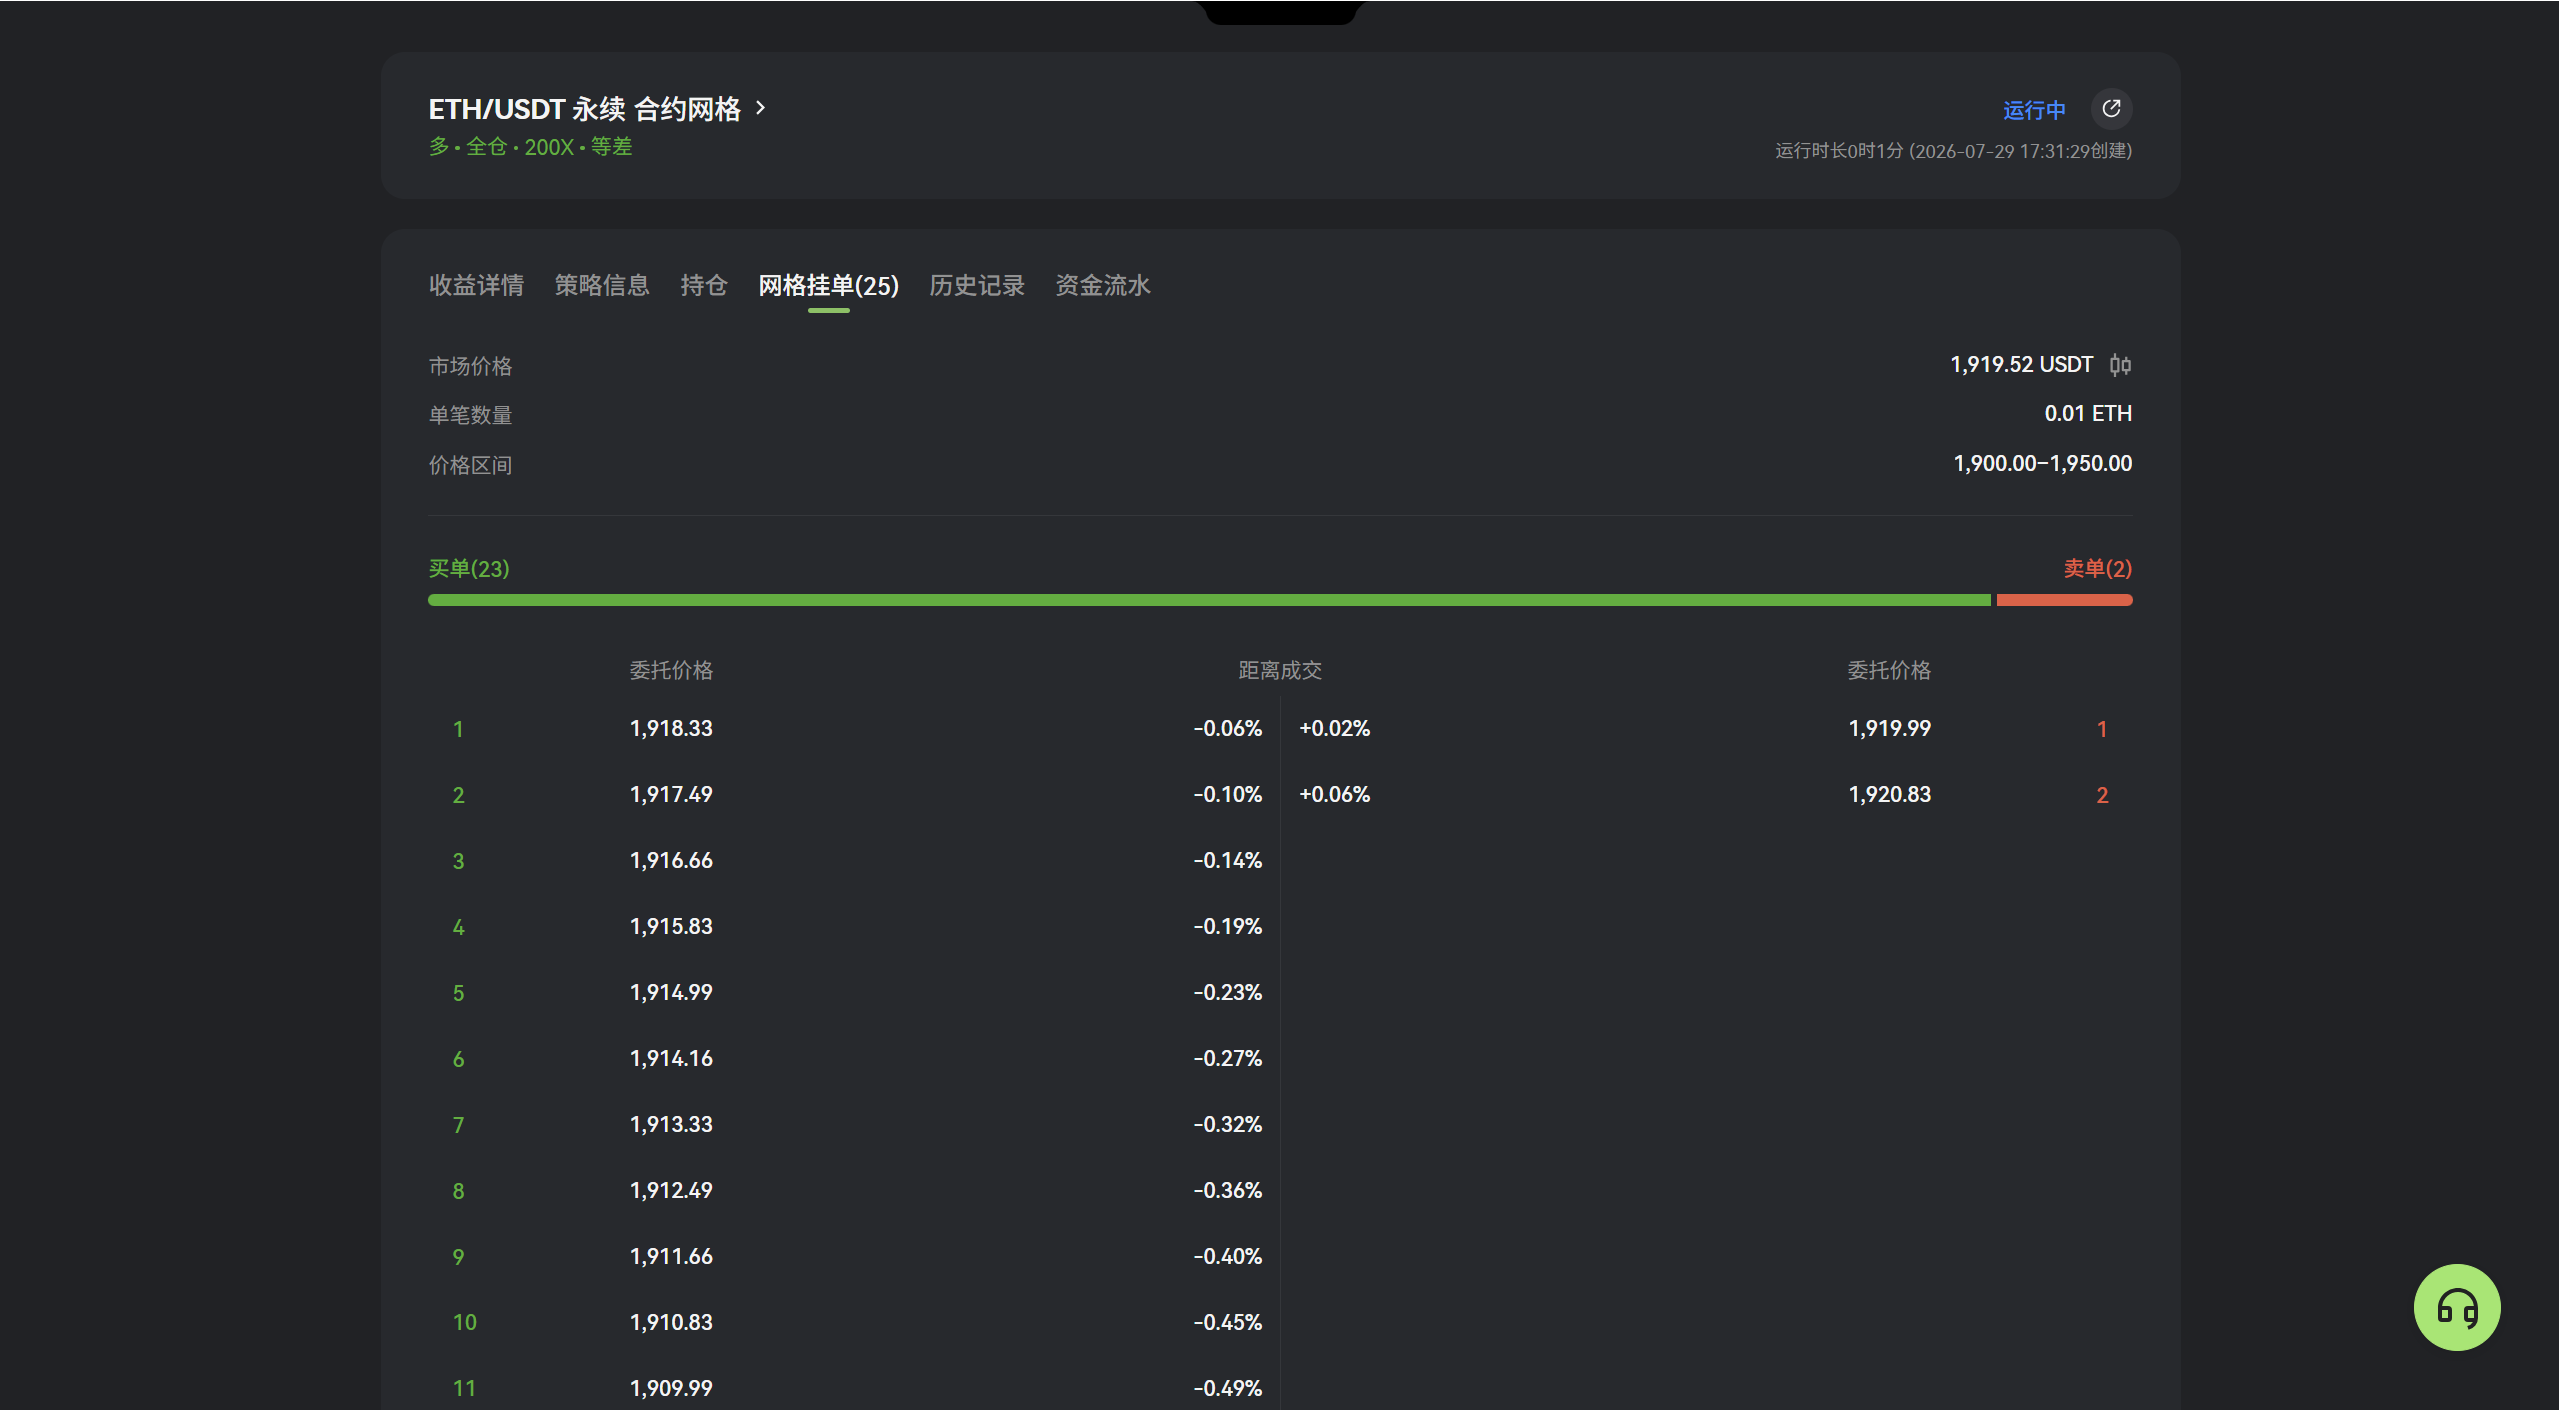
How the Two Modes Affect Trading Frequency and Per-Grid Returns
An arithmetic grid fixes the absolute price difference. If the range and order count remain unchanged, its price levels are distributed more evenly on the chart, making it easier to locate the next order on the candlestick price axis. However, as the price rises, the same price difference represents a smaller percentage of the entry price, so the theoretical return per grid is not identical at every level.
A geometric grid fixes the ratio between adjacent prices, so the theoretical gross return of each grid is more consistent. Orders are spaced more closely in the lower-price area and may be triggered by smaller fluctuations. At higher prices, the absolute spacing is wider, so the price must move by a larger amount to cross the next grid.
However, grid mode determines only how the price levels are arranged; it does not determine the final return by itself. Actual results per grid are also affected by the number of orders, order size per grid, fees, price precision, execution method, and slippage.
Based on the user's parameters and fee rate, Hotcoin displays an estimated per-grid return after fees. A strategy cannot be created if the estimated return is no greater than zero. If there are too many grids or the range is too narrow, reducing the number of grids or widening the price range can increase the distance per grid.
The important figure is the estimated per-grid return after fees, not merely the gross difference between adjacent prices. More executions do not necessarily produce a higher final net return.
How to Choose Between Arithmetic and Geometric Grids
When choosing a grid type, first determine the price range, number of grids, and expected volatility, then compare the actual price levels generated by each mode. Do not choose solely based on the asset's price or assume that one mode is inherently more profitable.
When the range is narrow, the intermediate prices generated by the two modes are usually similar. If you want every order to maintain a fixed price difference or prefer to read absolute distances directly from the price axis, an arithmetic grid is generally more intuitive.
When the range is wide, the difference between per-grid percentages at the upper and lower ends of an arithmetic grid becomes more apparent. If you want relative percentage moves at low and high prices to remain more consistent, a geometric grid is generally easier to compare. Educational material from major platforms also commonly associates arithmetic grids with relatively narrow ranges and geometric grids with wider price ranges.
Consider the following conditions as well:
-
Review the range width: The larger the difference between the highest and lowest prices, the more pronounced the percentage difference between the upper and lower ends of an arithmetic grid usually becomes.
-
Check market volatility: Grid spacing should be wide enough for the price to cross levels, but not so narrow that fees consume a large share of the result.
-
Check order size: More grids generally mean less capital available for each order, and the platform's minimum order requirements must still be met.
-
Compare the actual levels: Do not rely only on the labels "arithmetic" and "geometric." Review every price level ultimately generated by the platform.
-
Confirm the range-exit conditions: Both modes depend on a preset price range and cannot solve the problem of a market moving persistently in one direction.
Hotcoin futures grids currently allow 2 to 200 grids, but the selected parameters must still satisfy conditions such as the minimum quote increment, minimum margin investment, and positive per-grid return after fees.
Common Selection Mistakes
Assuming every arithmetic grid has the same return rate. An arithmetic grid keeps the price difference fixed, not the percentage. A 100 USDT difference represents different percentages when the entry prices are 1,000 USDT and 2,000 USDT.
Assuming a geometric grid is always better for high-priced assets. The asset's nominal price is not the main factor. What matters is the relative width of the price range, volatility, and number of grids.
Assuming a geometric grid carries less risk. A geometric grid changes only the order distribution. It does not eliminate the risks of the price leaving the range, fees, leverage, margin, or liquidation.
Ignoring the platform's price precision. Theoretical prices calculated by the formula may not match the trading pair's minimum price increment. The platform rounds prices according to its rules, so actual levels may differ slightly from manual calculations.
Comparing only gross price differences without checking net returns. A complete grid cycle usually includes opening and closing a position, or buying and selling. Fees directly reduce the actual result, and the issue becomes more noticeable as grids become denser.
Frequently Asked Questions
Is the difference between the two modes noticeable when the price range is narrow? Usually not. The closer the highest and lowest prices are, the more similar the intermediate levels generated by the two formulas become. You should still review the final order prices after the platform applies rounding.
Why do the platform's prices differ from the formula results? Theoretical prices may contain too many decimal places, while trading pairs normally have a minimum price increment. The platform rounds values according to its price precision, which can cause small differences.
Does a geometric grid produce exactly the same net return for every grid? Not necessarily. Geometric mode only keeps the theoretical price ratios approximately consistent. Actual net returns are also affected by fees, order quantities, rounding, and execution.
Can I switch between arithmetic and geometric mode after creating a Hotcoin grid? No. According to Hotcoin's official documentation, the arrangement mode cannot be changed after the grid is created. To change modes, terminate the original strategy and create a new one.
Usage Tips
Determine the price range and number of grids first, then compare the actual levels generated by the two modes. Grid type is only one parameter and cannot replace an assessment of market conditions, fees, capital, and the risk of the price leaving the range.
Risk Warning
Hotcoin currently provides futures grid functionality, which involves margin, leverage, fees, and liquidation risk. Neither arithmetic nor geometric mode guarantees returns. Existing positions may still incur losses if the price continues moving outside the preset range. This article is for user education and informational purposes only and does not constitute investment advice.
Leitura recomendada
Veja mais


Service@hotcoin.com
Product@hotcoin.com
Business@hotcoin.com
Casecn@hotcoin.com