Pullback Trading Strategy: Finding Low-Risk Entry Points in a Trend
The core logic of pullback trading is simple: inside an already confirmed uptrend or downtrend, price never travels in a straight line and always goes through short counter-directional swings. These pause or breathing phases are exactly where traders can enter or add to a position at a better price and with lower risk than chasing the move. A pullback is not a reversal: after a pullback price resumes the original trend, while a reversal means the trend has changed for good. Telling the two apart is what decides whether a pullback strategy works.
What is a pullback? Reading the pause button inside a trend
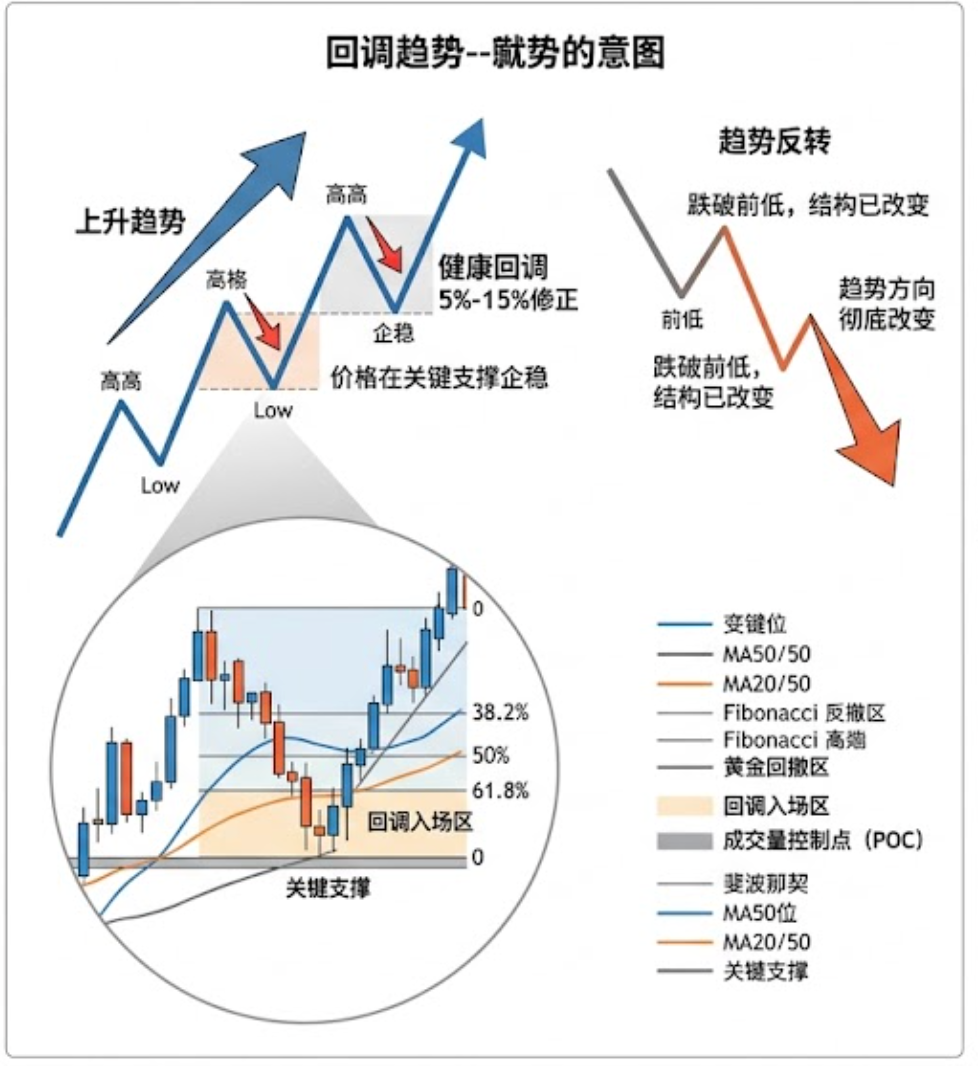
A pullback is a brief counter-trend move inside an already established trend. Its size usually falls between 5% and 15%, and it is the market's normal pause and correction phase. Because crypto is so volatile, pullbacks and rebounds can run deeper and faster than in traditional markets: a 10% drop in Bitcoin may be nothing more than a healthy pullback, while an altcoin losing 20% in a single day is not unusual in a bull market.
Pullback vs reversal: one word apart, worlds apart

The key test of whether a pullback is healthy is whether price stabilises inside a key support zone, rather than cutting straight through it and failing to bounce.
A four-step practical framework: from identification to execution
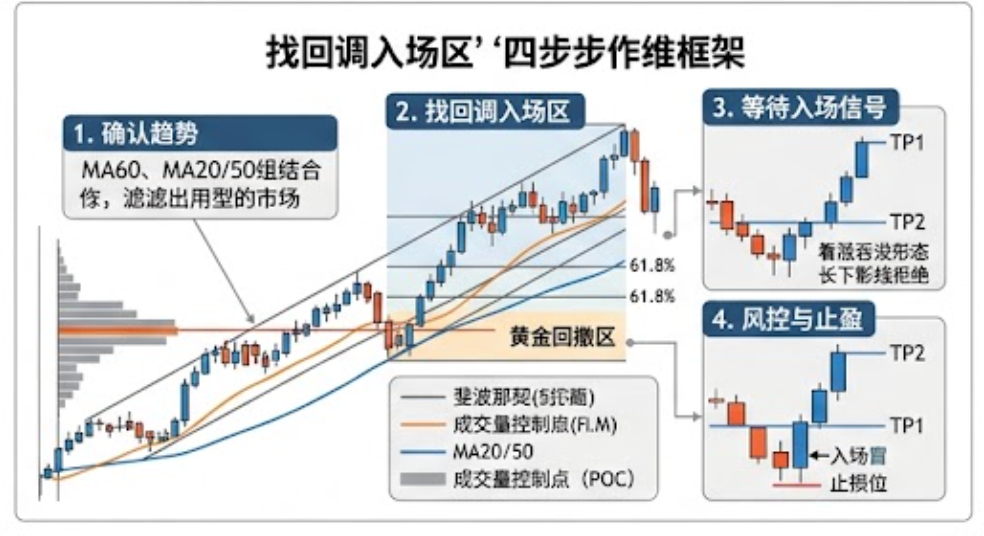
Step one: confirm the trend (the big-picture filter)
The first precondition of pullback trading is that a trend exists. If the market is ranging sideways, with flat moving averages and price crossing back and forth, the pullback strategy does not apply.
A common approach is to filter direction with the 60-day moving average, or a combination of the 50 SMA and the 20 EMA: when price is above the average and the average slopes up, look only for longs; when price is below the average and the average slopes down, look only for shorts.
Some mature pullback systems turn this into a hard filter. Above MA60 they only watch long signals, below it only short signals, which keeps them out of counter-trend trades.
Step two: find the pullback entry zone (confluence is what matters)
Once the trend is confirmed, the next task is to locate where price is likely to find its footing. A pullback zone drawn by a single tool is only a guess. Only when several technical tools point at the same price level does a high-probability pullback entry zone form.
Fibonacci retracement: in an uptrend, draw the levels from the swing low to the swing high. The retracement levels usually watched are 38.2%, 50% and 61.8%, and 61.8% is the golden retracement zone regarded as a high-probability reversal area.
Dynamic support and resistance: moving averages travel with price inside a trend and form dynamic support. The 20 EMA, which tracks short-term momentum, often lines up with shallower pullbacks of 38.2% to 50%, while the 50 SMA, which tracks the medium-term trend, often lines up with deeper pullbacks of 61.8% to 78.6%.
Volume profile goes one step further by locating the point of control, or POC: the price level where the most volume has traded in a given range. That is often where large institutions have built sizeable positions, and price tends to find support once it pulls back there.
Step three: wait for the entry signal (price action confirmation)
Price reaching the pullback zone does not mean you can enter immediately. Patiently waiting for candlestick patterns to confirm that the decline or the advance has stopped noticeably improves your win rate.
Common confirmation signals include:
Bullish engulfing or piercing line: after a decline, a large bullish candle body covers the previous bearish candle, showing that buyers have taken back control
Long lower wick rejection: price is pushed to a low and then pulled back strongly, leaving a long lower shadow
MA5 crossing above MA10 while the MACD histogram starts to grow: a precise way to catch the moment the pullback ends and the trend restarts
As one experienced trader puts it: "The best traders do not chase price. They wait for the market to come to their level, wait for confirmation, define the risk, and only then act."
Step four: risk control and take profit (locking in gains)
Stop loss: it belongs below the low of the entry candle, or below the key support level. Give the market enough room to breathe so a false breakout does not stop you out.
Take profit: use the high or low of the previous swing as the first target (TP1), or use the 1.272 and 1.618 Fibonacci extension levels as the main take-profit areas.
A crypto veteran who grew 200,000 in capital into tens of millions stressed one key discipline when sharing his experience: "Judge the trend first, then use the pullback to add 20% to 30% to your position. Even if you pay a little more than the exact bottom, it beats being stuck halfway up the mountain day after day by a factor of ten thousand. When the trend is absolute, direction always matters 100 times more than agonising over a perfect entry price."
Case study: ETH retesting Fibonacci and volume profile
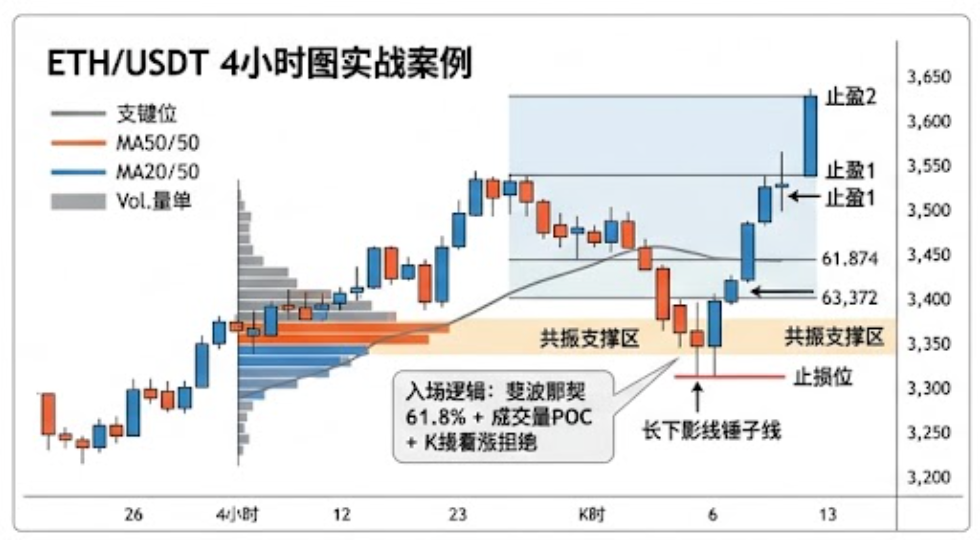
Suppose ETH rallies from $3,200 to $3,650 and then starts to pull back. On the 4-hour chart you draw the Fibonacci retracement from $3,200 to $3,650, and the 61.8% level sits at about $3,372. Checking the volume profile at the same time, the point of control also falls near $3,370. Two tools point at the same area.
Price keeps pulling back and prints a hammer with a long lower wick near $3,370, a bullish rejection signal. You enter long at the open of the next candle, place the stop loss below the hammer's low, set TP1 at the previous high of $3,650, and use the 1.618 extension for TP2.
The point of the case is this: the trade is not a random buy at $3,372, but a decision made after several tools line up and the candlestick finally gives a clear signal.
Three common mistakes in pullback trading
Mistake one: treating a pullback as a reversal. In a clear uptrend, price pulling back to support and then rising again is normal continuation behaviour, not a signal that the trend is over.
Mistake two: entering the moment price reaches a pullback level. Fibonacci levels and moving averages only mark potential reversal zones, and price action still has to confirm them. Catching a falling knife without confirmation is the most common trap in pullback trading.
Mistake three: forcing the pullback strategy in a ranging market. A trend is the lifeline of the strategy. When moving averages flatten and price keeps crossing the range, the pullback strategy gets stopped out again and again.
FAQ
Q1: How is pullback trading different from breakout trading?
Pullback trading enters when price returns to a support zone, which gives a better entry and a tighter stop. Breakout trading follows price when it breaks a key level on strong volume, which offers more certainty but a worse entry. Both trade with the trend; only the timing differs.
Q2: How do you tell a healthy pullback from a trend reversal?
A healthy pullback is moderate in size, usually no deeper than the 61.8% Fibonacci retracement, without panic volume expansion, and price finds support at a key zone such as a moving average or a Fibonacci level, stops falling, stabilises and then resumes the original trend. A reversal shows up as price breaking below key support without a convincing bounce, volume expanding abnormally or shrinking persistently, and the price structure of highs and lows being destroyed.
Q3: Is pullback trading suitable for beginners?
Yes, with conditions. Pullback trading is safer than blindly chasing rallies and dumping into falls because it offers a better entry and a tighter stop. The conditions are that you can clearly judge that a trend exists and that you are willing to wait for confirmation after the pullback completes, instead of jumping in the moment price drops. Start with strong major coins on the daily or 4-hour chart.
Related tutorials:
Trend Following Strategy: A Profitable Methodology of Going with the Trend
Breakout Trading Strategy: Capturing the Key Point of a Market Expansion
Recommended reading:
読書をお勧めします
もっと見る