Exchange Interface Explained: Understand a Trading Page in 5 Minutes
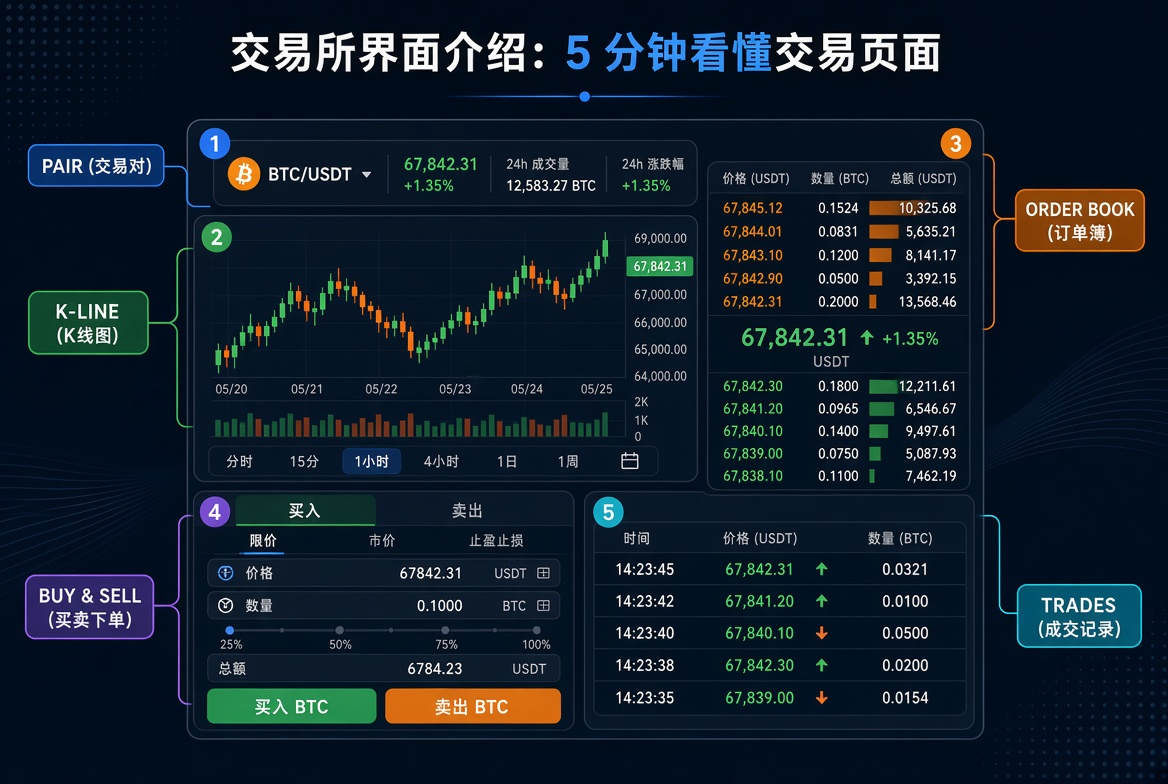
An exchange trading page is usually made up of the trading pair, market data, the candlestick chart, the order book, trade history, the order form and account assets. Beginners do not need to read every number at once. Once you know these 7 areas, you can answer the questions that matter: what am I trading, what is the market price, where are the buy and sell orders, how do I place an order, and did my order fill?
If this is your first time using a crypto exchange, start with Blockchain Exchange Basics: From Sign-Up to Your First Trade, then come back to the trading page to study its features. The walkthrough below uses a typical spot trading page to help you build a complete picture of the interface.
What are the main areas of a trading page?
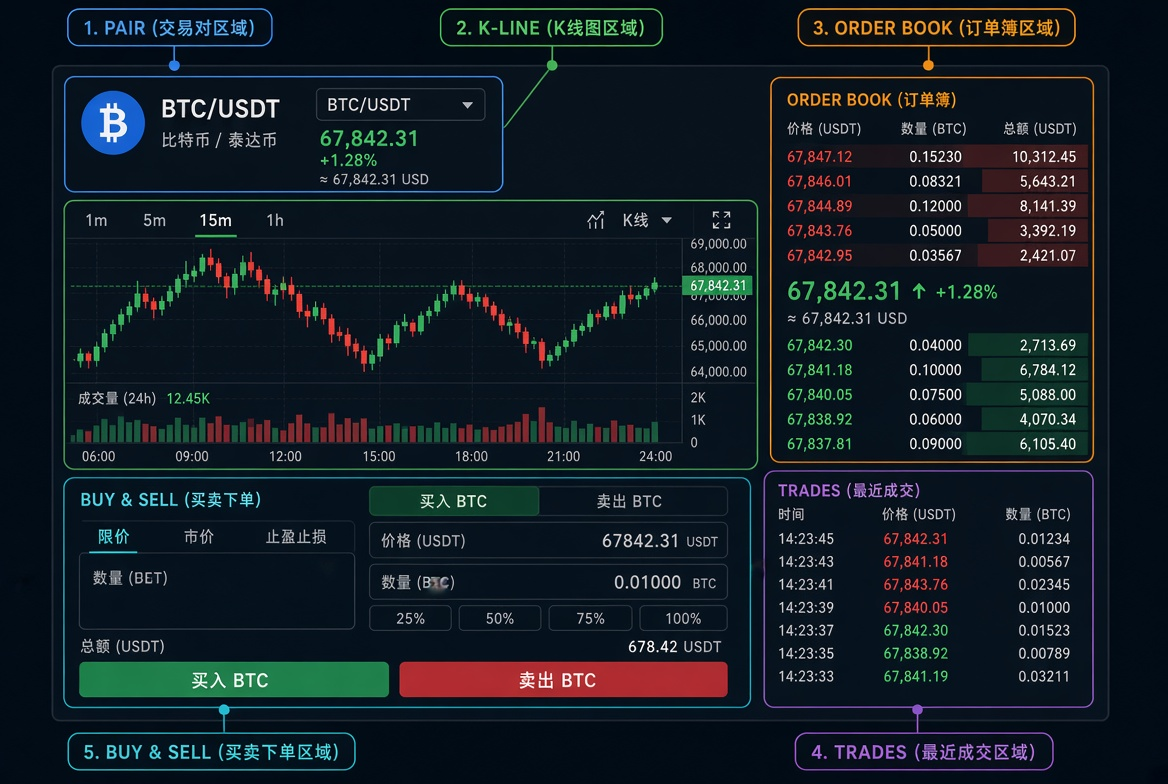
Layouts differ slightly from one exchange to another, but the core information is much the same. A useful way to read the page is as a path: pick a market → check the price → check the order book → choose an order type → enter the amount → check your balance → submit the order. You do not have to memorise every figure on screen.
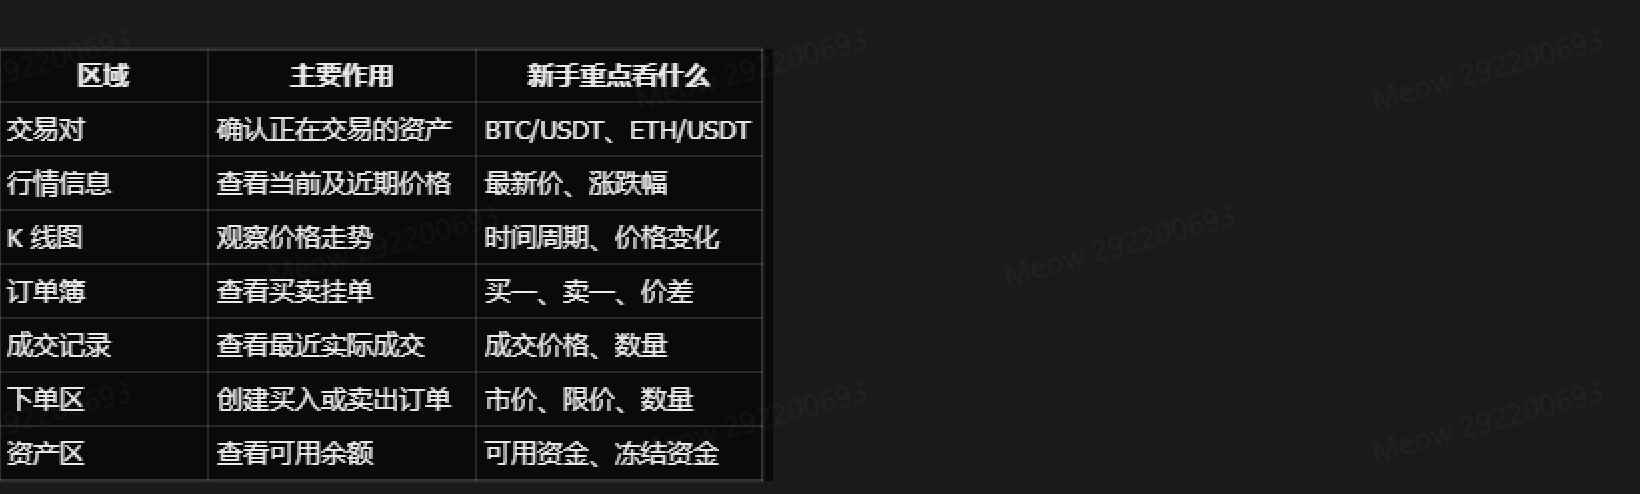
Understanding how these areas relate to each other matters more than memorising "what an order book is" or "what a candlestick is", because in a live trade they all work at the same time.
Step 1: Confirm the trading pair first
The first thing to check on a trading page is the trading pair, because it decides which asset you are buying or selling and which asset you are pricing it in. BTC/USDT, for example, means trading BTC with USDT: BTC in front is the base asset, USDT after it is the quote asset.
Choosing the wrong pair is an easy mistake for beginners. If you meant to buy BTC but landed on the ETH/USDT page, a successful fill still leaves you holding an asset you never wanted, so always double-check the pair before submitting an order.
If names like BTC/USDT and ETH/BTC are still unfamiliar, read What Is a Trading Pair? BTC/USDT vs ETH/BTC first to see what the base asset and the quote asset each represent.
Step 2: Read the market data at the top
Below the pair, or at the top of the page, you will normally see the latest price, the 24-hour change, the 24-hour high and low, and trading volume. These figures help you read the current state of the market quickly, but they do not tell you where the price will go next.
The latest price is the price of the most recent fill, the 24-hour change shows how the price has moved over the past day, and the high and low help you frame a short-term range. If you are just getting started, these basics are enough; you do not need a wall of technical indicators on day one.
Step 3: How do you actually read a candlestick chart?
A candlestick chart shows how the price moved over different time frames. Each candle usually carries an open, a high, a low and a close. By switching between 1 minute, 5 minutes, 1 hour, 4 hours and 1 day, you can watch price action at different scales.
Remember that a candlestick chart answers "how the price moved in the past", not "where the price will certainly go next". The most common beginner mistake is chasing a single fast-rising candle. A better habit is to confirm your direction, your order type and the price you are willing to accept before you place anything.
Step 4: How do you read the order book?
The order book is the area that overwhelms beginners most, yet it only shows the buy and sell orders in the current market that have not been filled yet. Asks usually sit at the top, bids at the bottom, and the prices closest to each other sit near the middle.
The highest price a buyer is willing to pay is the Bid; the lowest price a seller will accept is the Ask. The gap between them is the spread. A wider spread means buyers and sellers are quoting further apart; pairs with better liquidity usually show tighter quotes, though you still need to watch the specific market to judge.
One point adds real information: the order book is not a complete supply-and-demand table for the whole market. It only shows the orders visible at one exchange, for one pair, at one moment. Orders can appear, fill or be cancelled at any time, so a large wall of buy orders does not prove that the price cannot fall.
Step 5: How is trade history different from the order book?
The order book shows orders that have not been filled, while trade history shows trades that have actually happened. Reading the two side by side helps you separate "someone wants to trade" from "a trade really happened".
A large batch of sell orders at one price in the order book only proves that those sell orders exist; it does not prove they will all fill. If trade history keeps printing fills at higher prices, short-term buying pressure may be building. Even then, judge from the fills rather than from the number of resting orders alone.
Step 6: What matters most in the order form?
The order form usually offers both a buy and a sell side, and depending on the exchange and market type it may offer market orders, limit orders and more. The first thing a beginner needs to understand is this: are you choosing how fast you fill, or are you controlling the price you fill at?
A market order is built for speed: it fills as soon as possible at whatever prices the market offers, so it is simple to use, but the price you actually get can differ from the one on screen because of volatility and order book depth. A limit order lets you set a specific price, but it only fills when the market meets your condition, so it may sit unfilled for a long time.
If you want to go further into choosing between the two, read What Is Spot Trading? The Simplest Way to Buy Crypto to understand the basic logic of spot trading.
Step 7: Always check your available balance before ordering
The order form normally shows the balance your account can trade with. Buying BTC/USDT means checking that you have enough USDT; selling BTC means checking that you hold enough BTC. Available balance and total account assets are not always the same, because some funds may already be held by open orders.
Beginners should also check the order amount, the price and the estimated total. With a limit order especially, do not submit just because a number looks familiar: check the pair, the side, the price and the amount once more, then confirm.
Understand the trading page in 5 minutes
If you are opening a trading page for the first time, run through this order:
① Check the pair: confirm whether you are trading BTC/USDT, ETH/USDT or another market. ② Check the latest price: see roughly where the market stands. ③ Check the chart: see whether price has been rising, falling or ranging recently. ④ Check the order book: see current quotes and the spread. ⑤ Check trade history: see where trades actually filled recently. ⑥ Choose the order type: pick a market or limit order for your purpose. ⑦ Check available balance: confirm how much of the asset you can buy or sell. ⑧ Review the order last: confirm pair, side, price and amount, then submit.
The point of this routine is not to predict price but to avoid operational mistakes. For a beginner, running one trading-page check correctly is usually more practical than studying dozens of technical indicators from the start.
The 5 things beginners misread most
First, reading the wrong pair, for example confusing BTC/USDT with ETH/USDT. Second, reading the wrong side, submitting without confirming whether you are buying or selling. Third, treating the latest price as the price you will certainly get: the market keeps moving, and your final fill price also depends on the order type and the liquidity at that moment.
Fourth, mistaking resting orders in the order book for completed trades; the two carry completely different information. Fifth, ignoring unfilled orders: if a limit order does not fill immediately, your funds may be locked by that order, so check "Open Orders" or the equivalent area for its status.
What should you learn after you can read the interface?
Once you can identify the pair, the chart, the order book, trade history and the order form, the most valuable next step is the full spot trading workflow. You will want to understand how to choose a side, set an order price, confirm a fill and review the result.
The trading page is only a tool. Order types, trading fees, liquidity and risk control all shape the outcome just as much. So do not rush into a large trade simply because the page now makes sense; start small and learn the whole flow first.
FAQ
Why does the exchange trading page show so many numbers?
Because the page has to display price, volume, resting buy and sell orders, historical trades and account assets at the same time. Beginners do not need to master all of it: understanding the trading pair, latest price, candlestick chart, order book and order form is enough to complete a basic trade.
What do green and red mean in the order book?
Colour design differs between exchanges, but in the common layout green marks buy orders and red marks sell orders. Do not rely on colour alone; confirm the meaning against the Bid, Ask, price and amount fields.
Is the price on a candlestick the price I will get after ordering?
Not necessarily. A candlestick shows historical price movement, while your actual fill price depends on the order type, order book liquidity and the state of the market when you submit. With market orders in particular, a fast-moving price or thin liquidity can leave your fill price different from the price shown at that instant.
Why did my limit order not fill immediately?
Because a limit order fills only when the market reaches your condition and a counterparty is available. If your buy price is below the current Ask, or your sell price is above the current Bid, the order may simply stay in the order book and wait.
What does 24H Volume mean on the trading page?
24H Volume usually means the trading volume of that market over the past 24 hours, which helps you gauge how active it is. On its own it does not guarantee that trading will be easy; execution also depends on the order book depth and the spread of that specific pair.
Risk disclaimer
Crypto prices are highly volatile, and the live price, order book and trade history on a trading page all change quickly. Market orders can be affected by slippage and limit orders may never fill; leverage and futures trading add margin requirements and forced liquidation risk.
Before trading for real, confirm the trading pair, the side, the order type, the price, the amount and your available balance. Beginners should practise with small amounts of money they can afford to lose, and should not ignore market risk just because the interface now looks familiar.
読書をお勧めします
もっと見る