Bitcoin Rainbow Chart Explained: What the Price Bands Mean and How to Use Them
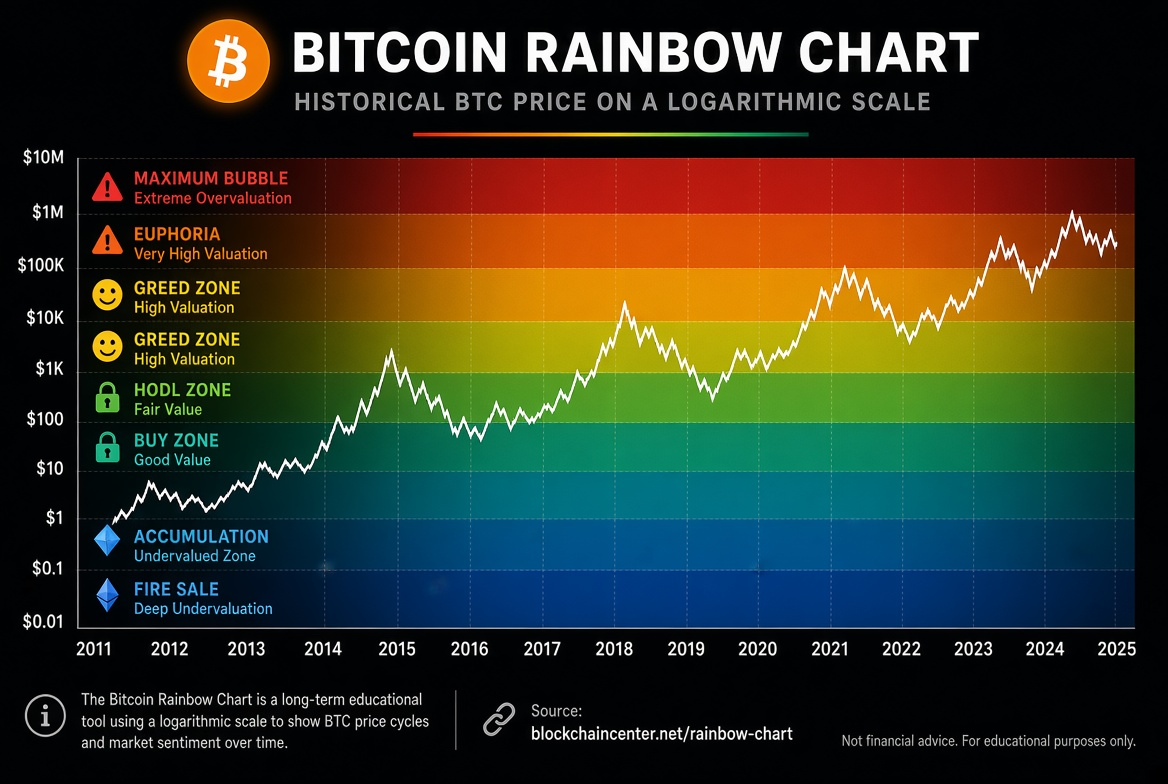
The Bitcoin Rainbow Chart is a long-term analysis tool that uses logarithmic regression to divide BTC's historical price into a set of colored valuation bands, helping you judge whether the current price looks cheap, fair, or expensive relative to its historical trend.
The rainbow chart does not predict tomorrow's move. It offers a medium- and long-term perspective: where Bitcoin currently sits along its growth path. It suits dollar-cost-averaging investors, long-term holders, and cycle watchers especially well, as a way to gauge accumulation zones and overheated zones.
What Is the Bitcoin Rainbow Chart
The Bitcoin Rainbow Chart plots the long-term price of BTC on a logarithmic scale and overlays a set of colored bands. Each band represents a different historical valuation and market sentiment range, from deep undervaluation at the bottom to bubble territory at the top.
The logarithmic scale is used because Bitcoin's price spans several orders of magnitude. An ordinary linear scale would compress the early years until they are almost invisible, while a logarithmic scale shows the long-term growth path more fairly.
What the Rainbow Chart Price Bands Usually Mean
Different versions of the chart vary slightly in the number of colors and their names, but the logic is broadly the same. From bottom to top, the common bands are:
Fire Sale / deeply undervalued: a rare deep low, often treated as a strong accumulation zone.
BUY / buy zone: still cheap relative to the long-term trend, suitable for phased buying.
Accumulate / accumulation zone: the comfortable range where medium- and long-term dollar-cost averaging usually sits.
Still Cheap: not overheated yet, so holding or buying slowly is still reasonable.
HODL / hold zone: close to long-term equilibrium, where holding dominates.
Is this a Bubble?: heat is building, so raise your risk awareness.
FOMO / sentiment heating up: optimism is spreading and the risk of chasing highs increases.
Sell. Seriously, SELL! / overvalued: historically close to the overheated phase of a cycle.
Maximum Bubble Territory: the topmost risk zone, where volatility and drawdowns tend to be largest.
These bands are the result of historical curve fitting, not absolute buy or sell instructions.
How to Use the Bitcoin Rainbow Chart
Start with the current position: check which band BTC sits in, and decide whether that reads as an accumulation zone, a hold zone, or an overheated zone.
Use it to pace your position, not as a short-term signal
Blue/green zones: consider stepping up dollar-cost averaging or buying in phases
Yellow zone: mostly hold and observe
Orange/red zones: reduce the urge to chase, and focus on trimming and risk control
- Read it alongside other indicators: the rainbow chart can be cross-checked with:
Realized price, MVRV
AHR999
Fear & Greed Index
On-chain activity and holder structure
Macro liquidity conditions
- Watch the crossings, not just the static position: when price moves from lower bands to higher bands, the cycle is heating up; when it falls back from higher bands, heat is fading. What matters is the change in trend position, not one day's exact reading.
A Practical Example
Suppose Bitcoin is sitting in the green accumulation band:
Long-term investors might keep dollar-cost averaging, or buy more frequently during drawdowns.
If price moves into the orange or red zones:
The more reasonable move is usually to stop adding new money at highs and evaluate phased profit-taking, rather than abandoning risk control because "it will go higher."
For beginners, the greatest value of the rainbow chart is this: it turns "does this feel expensive?" into an observable position relative to history.
Advantages of the Rainbow Chart
Intuitive: the long-term position is clear at a glance
Helps curb FOMO and panic
Especially useful for dollar-cost-averaging strategies
Emphasizes cycle thinking rather than intraday noise
Limitations of the Rainbow Chart
Based on historical curve fitting: once growth rates, participant structure, and the macro environment change, the meaning of the bands drifts.
Version differences: different websites use different regressions and band spacing, so the numbers can differ.
It cannot pinpoint exact tops and bottoms: it gives a sense of zone, not trading levels.
It can fail badly in the short term: under a violent news shock, price can cross several bands quickly.
Who It Suits and Who It Does Not
Suits:
Long-term holders
Dollar-cost-averaging users
Researchers who need cycle positioning
Not for people who rely on it alone:
Very short-term traders
Anyone who only wants a "buy or sell today" signal
High-leverage traders who ignore risk management
Risk Warning
The Bitcoin Rainbow Chart is only a long-term reference tool and does not constitute investment advice. Historical price bands do not guarantee the same effectiveness in the future. Crypto assets are extremely volatile and can lead to significant loss of principal. Make decisions based on your own risk tolerance, and avoid relying on a single indicator for everything.
FAQ
Q1: Who invented the Bitcoin Rainbow Chart? A: It was first proposed by community members as a visualization, then improved in different versions; its core is logarithmic regression with colored valuation bands.
Q2: Can the rainbow chart predict next year's high? A: Not precisely. It is better at describing relative valuation than at giving an exact target price.
Q3: Why do different websites show different rainbow charts? A: Because the regression model, the starting point of the data, and the band spacing may differ. It is best to follow the trend using one consistent source.
Q4: Must I sell as soon as price enters the red zone? A: Not necessarily. The red zone means it is historically hot and risk is rising, but that does not equal an immediate top. Raising risk control is more reasonable than acting on absolutes.
Q5: How should a beginner use the rainbow chart for dollar-cost averaging? A: Increase the DCA amount in the blue/green zones, keep the usual DCA in the yellow zone, slow the pace of buying in the orange/red zones, and always stick to long-term discipline.
With the above, you now understand what the price bands of the Bitcoin Rainbow Chart mean and how to use it for long-term positioning and DCA pacing. Its value is not in telling you to buy or sell tomorrow, but in reminding you which part of the cycle you are in. Once the position is clear, decisions become calmer.
読書をお勧めします
もっと見る