
What Are Market Cap, Circulating Supply, and Fully Diluted Valuation (FDV)?
Market capitalization is the current price multiplied by the circulating supply. FDV also includes supply that is not yet circulating. The gap between them can reveal potential dilution, but it cannot determine by itself whether a token is expensive or cheap.
To use these metrics correctly, first distinguish among circulating supply, total supply, and maximum supply. You should also confirm which supply basis a market-data platform uses, because the same token may have a different FDV on different platforms.
What Are Market Cap, Circulating Supply, and FDV?
Circulating supply is a market-data platform's estimate of the number of tokens currently available for the public to hold and trade. Locked team allocations, unvested investor allocations, and some project treasury holdings are generally excluded, although platforms do not all apply the same exclusion criteria.
Market cap applies the current market price to all circulating tokens. It is useful for comparing the relative size of assets under their current supply conditions, but it is neither cash held in a project's account nor the cumulative amount of money invested in the market.
FDV stands for Fully Diluted Valuation. It assumes that the total supply or maximum supply is valued at the current price, presenting the theoretical scale of a token when non-circulating supply is included. “Fully diluted” is a static assumption; it does not mean the price will remain unchanged when tokens unlock in the future.
| Metric | Common definition | Main use | Often-overlooked issue |
|---|---|---|---|
| Circulating supply | Estimated amount currently available for the public to hold and trade | Calculate current market cap | Data platforms may exclude different wallets |
| Total supply | Amount minted minus verifiably burned tokens | Measure tokens that currently exist | Includes locked or temporarily non-circulating tokens |
| Maximum supply | Theoretical upper limit permitted by protocol rules | Assess the long-term issuance ceiling | Some tokens have no fixed cap |
| Market cap | Current price multiplied by circulating supply | Compare current relative valuation size | Does not equal capital inflow or realizable value |
| FDV | Current price multiplied by total supply or maximum supply | Assess potential supply dilution | Both the supply basis and price assumption have limitations |
How Are Market Cap and FDV Calculated?
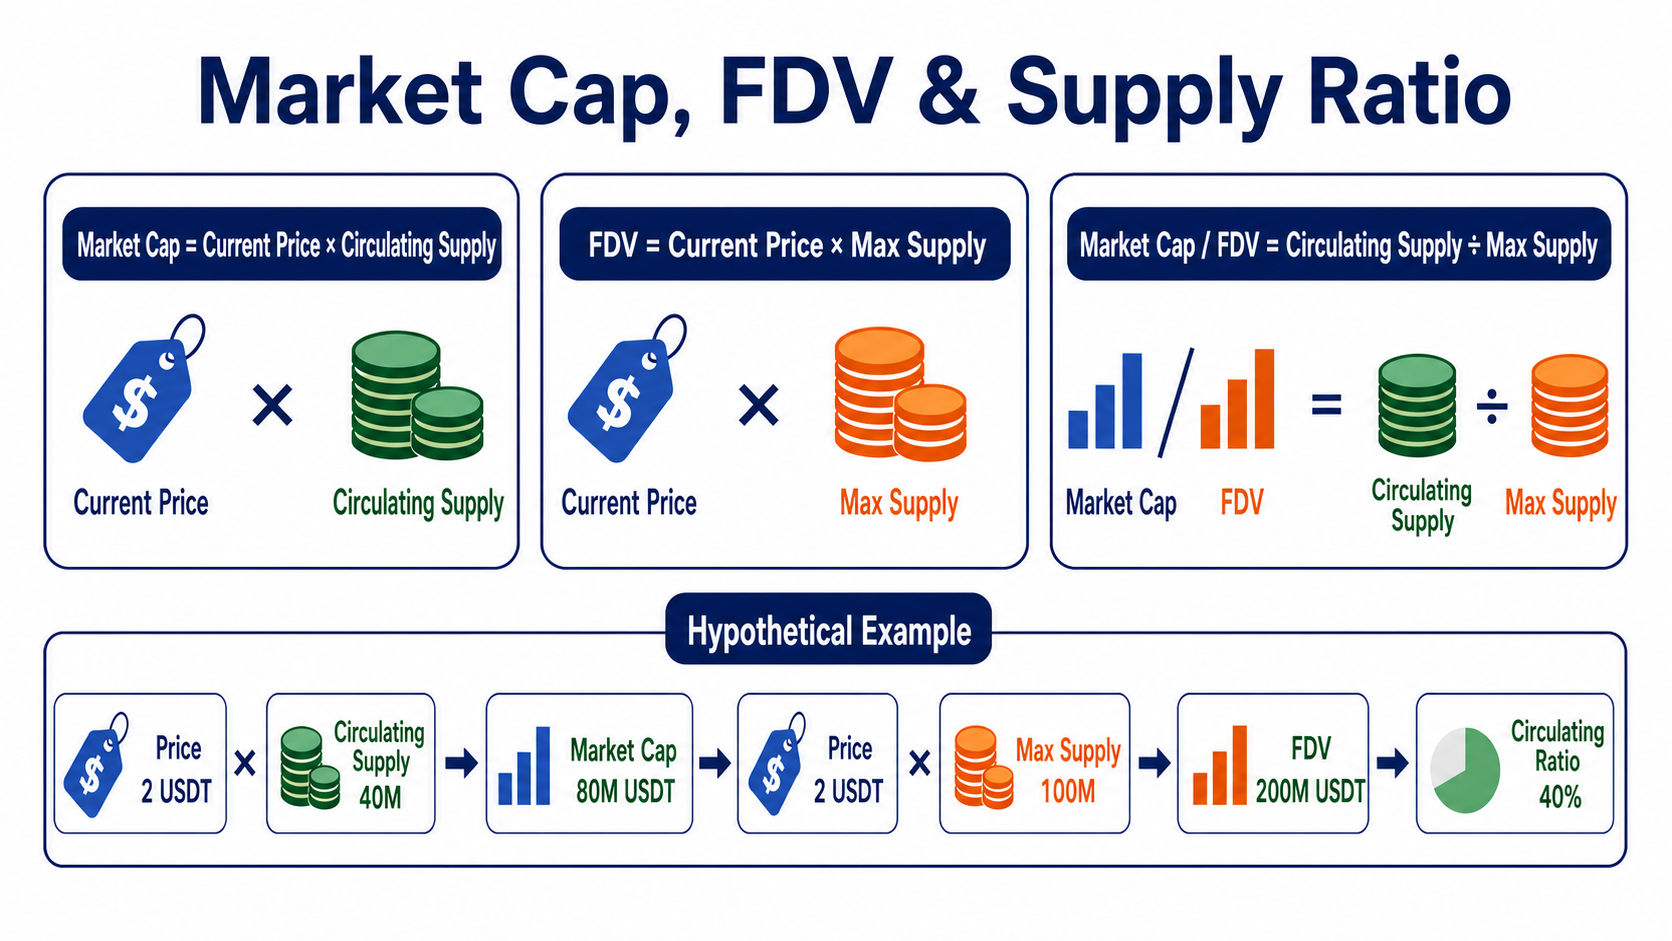
Market cap uses the current circulating supply. The basic formula is:
Market cap = Current token price × Circulating supply
FDV commonly uses one of two formulas:
FDV = Current token price × Maximum supply
FDV = Current token price × Total supply
Platforms do not use a uniform FDV methodology. When a fixed maximum supply exists, platforms commonly use it; some pages instead calculate FDV from total supply. Always check the platform's definition before comparing the displayed results.
You can also calculate the ratio of market cap to FDV:
Market cap / FDV ratio = Circulating supply ÷ Supply basis used for FDV
When the same price basis is used, this ratio primarily indicates how much of the relevant supply has already been included in circulating market cap. A low ratio means more supply remains outside circulating supply, but it does not prove that those tokens will unlock or be sold soon.
A Hypothetical Calculation Example
The following figures are for calculation purposes only. They do not represent any real token or any historical or expected return.
Suppose a token is priced at 2 USDT, with a circulating supply of 40 million tokens, a total supply of 80 million, and a maximum supply of 100 million.
Market cap = 2 × 40 million = 80 million USDT
If a platform uses maximum supply:
FDV = 2 × 100 million = 200 million USDT
Market cap / FDV = 80 million ÷ 200 million = 40%
If another platform uses total supply:
FDV = 2 × 80 million = 160 million USDT
The two platforms produce different FDV figures from the same price and supply data, not because either formula is wrong, but because one uses maximum supply and the other uses total supply. The maximum-supply calculation includes the 20 million tokens that have not yet been minted, while the total-supply calculation includes only tokens that already exist.
This example also does not imply that the future market cap will necessarily reach 200 million USDT. As tokens unlock, circulating supply, demand, liquidity, and market price may all change. Holding the current price constant is merely a way to make the supply structure easier to understand.
Why Does Circulating Supply Change?
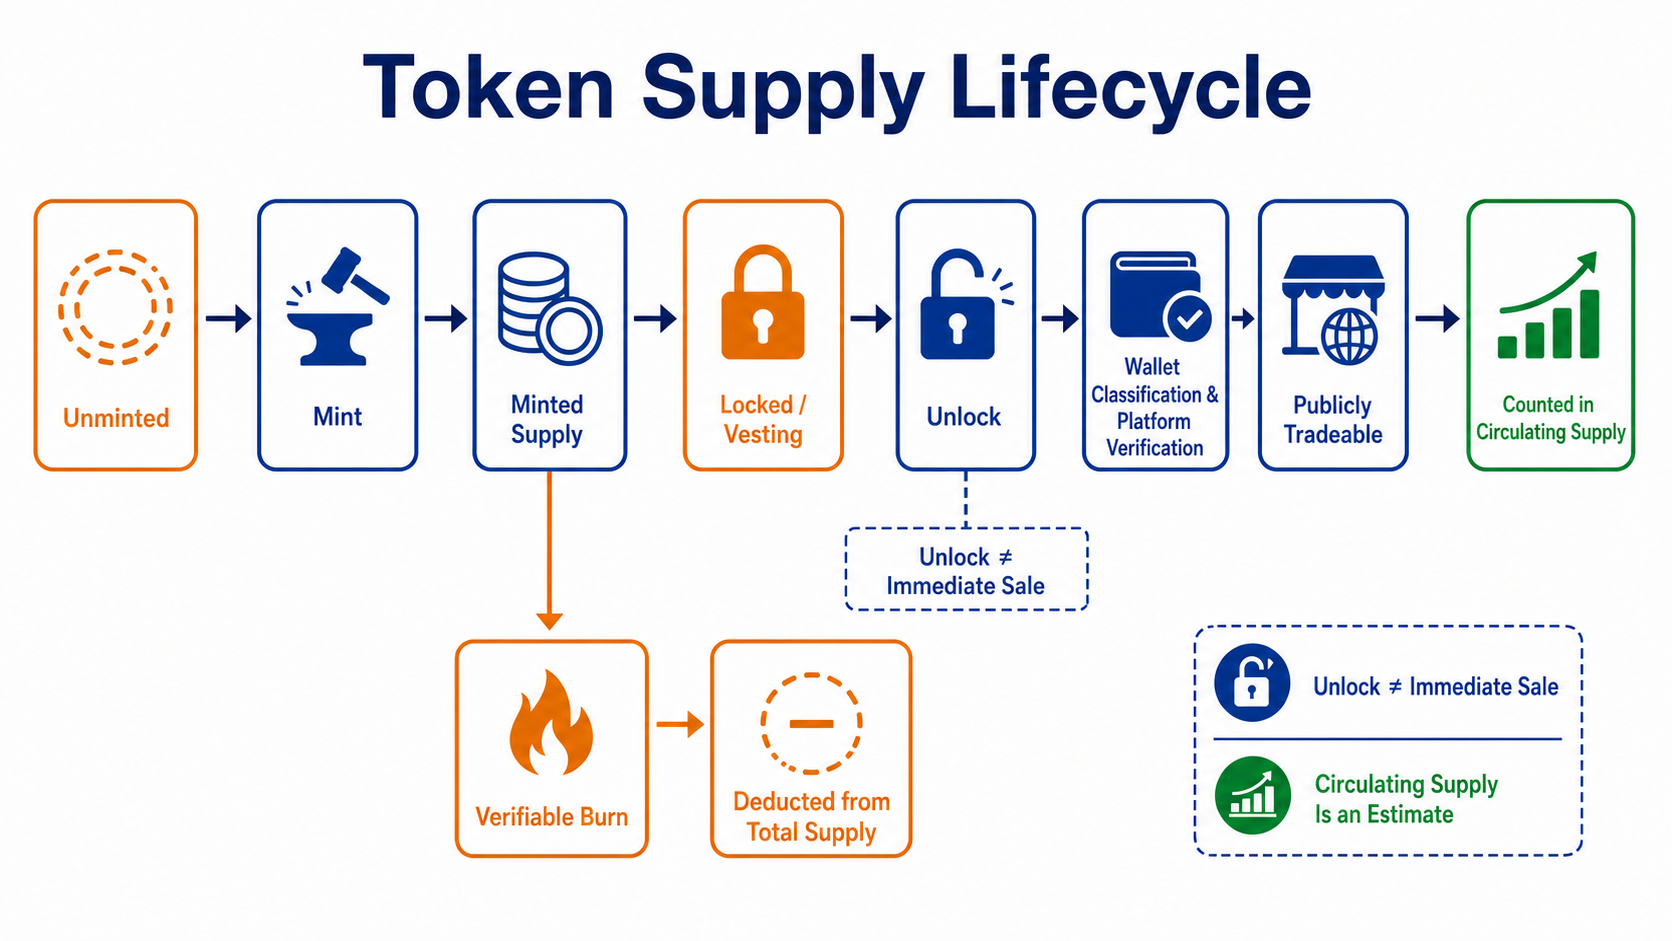
Circulating supply is not a permanently fixed protocol figure. New issuance, mining or staking rewards, completed vesting periods, and ecosystem incentives can all move more tokens into the publicly tradable supply. Burns may reduce total supply, but whether they also reduce circulating supply depends on whether the burned tokens were previously counted as circulating.
It helps to think of tokens as moving through several states:
- Tokens that have not been minted are not part of total supply, although tokens with a fixed cap include them in maximum supply.
- Minted but locked tokens are part of total supply and are generally not part of circulating supply.
- An unlock does not necessarily mean that a token immediately enters the circulating supply recognized by a data platform. Team or treasury wallets may remain excluded under a platform's methodology even after their tokens become transferable.
- Tokens entering the public market increase circulating supply. Because data platforms must also update on-chain data and wallet classifications, their displayed figures may change at different times.
- Verifiable burns are deducted from total supply. Tokens that are inaccessible but cannot be proven permanently lost are generally not automatically removed from public supply figures.
This is also why different data websites may report different circulating supplies. Circulating supply is essentially an estimate based on on-chain supply, lockup arrangements, wallet ownership, and platform rules; not every network can provide a single, indisputable figure directly.
What Does the Gap Between Market Cap and FDV Mean?
The gap between market cap and FDV describes a supply gap. When it is large, investigate whether the non-circulating tokens belong to the team, investors, a foundation, community incentives, mining rewards, or long-term issuance that has not yet been minted. Each source can have a different release schedule and intended use.
At a minimum, evaluate the gap alongside the following factors:
- Unlock schedule: Check the amount and frequency of each unlock and the final vesting date instead of relying only on a cumulative percentage.
- Recipients: Teams, early investors, ecosystem funds, and staking participants may have different cost bases and intended uses.
- Actual increase in circulating supply: Not every unlocked token immediately becomes tradable supply, and platforms may update their circulating-supply figures later.
- Market liquidity: The same amount of additional supply may have different effects in a deep market and a thin one.
- Token demand: Assess whether fees, staking, governance, or application use can absorb additional supply by looking at actual protocol activity.
- Issuance rules: Maximum supply may be fixed or may change through governance or protocol parameters. For assets without a fixed cap, annual issuance and net supply changes matter more.
For a more detailed analysis of supply allocation, vesting arrangements, and token utility, read What Is Tokenomics?.
What Are the Limitations of FDV?
FDV's biggest limitation is that it applies the current price to future supply. The price comes from marginal trades in the currently tradable portion, but supply and demand may have changed by the time non-circulating tokens enter the market. FDV is therefore a supply valuation at a uniform price, not a forecast of future market cap.
FDV also does not express time. A concentrated unlock over one month and gradual issuance over ten years may have the same FDV but very different supply paths. Comparing FDV alone does not show when additional supply will appear.
Moreover, maximum supply is not always available. Some protocols have no fixed cap, some tokens can be minted or continuously burned, and some projects have supply data that platforms have not verified. In such cases, FDV may be unavailable, may use total supply instead, or may change significantly with the methodology.
Low circulating supply can also magnify problems with the price assumption. When actual market depth is limited, a small number of trades can change the displayed price, which is then multiplied across the entire supply to produce a seemingly enormous FDV. That result does not mean every token could be sold at that price.
How Should You Compare the Valuations of Two Tokens?
Before comparing them, confirm that both pages use the same quote currency, prices from similar times, and the same FDV basis. Then follow these steps:
- Verify the contract address and network to rule out identically named tokens, wrapped assets, or an incorrect page.
- Record circulating supply, total supply, maximum supply, and the time the data was updated.
- Recalculate market cap and FDV using the displayed price to verify that you can reproduce the figures.
- Review the official issuance and unlock schedule, distinguishing minted but locked supply from future unminted supply.
- Calculate the expected increase in circulating supply over the next 30 days, 90 days, or one year instead of looking only at the final cap.
- Consider market cap and FDV alongside market depth, holder concentration, protocol revenue, and usage demand rather than drawing a conclusion from a single multiple.
Market cap can help compare current size, while FDV can reveal non-circulating supply. Neither metric, however, can replace an analysis of project utility, governance powers, and the supply schedule. To build a foundation in token categories and valuation frameworks first, return to the Crypto Asset Beginner's Guide.
Frequently Asked Questions
Does a Lower Token Price Mean a Cheaper Valuation?
No. Unit price is affected by the number of token units. Compare market cap, supply structure, and actual utility instead of assuming that a token priced at 0.01 USDT is cheaper than one priced at 100 USDT.
Why Do Some Tokens Not Display an FDV?
Common reasons include the absence of a fixed maximum supply, unverified supply data, or the data platform not having selected a usable calculation basis. A missing FDV does not mean the supply cannot increase.
Does a Higher Market Cap Mean Better Liquidity?
No. Market cap is price multiplied by circulating supply, while liquidity depends on order book depth, trading volume, the number of markets, and the amount that can be executed. Even a high-market-cap asset may have limited depth on some trading pairs or networks.
Is a Market Cap-to-FDV Ratio Near 100% Always Better?
No. A ratio near 100% only means that, under the chosen methodology, the current circulating supply is close to the fully diluted supply. It says nothing about product demand, token allocation, holder concentration, or protocol security.
読書をお勧めします
もっと見る



Service@hotcoin.com
Product@hotcoin.com
Business@hotcoin.com
Casecn@hotcoin.com