
Hotcoin Research | Bitcoin Reclaims $80,000: Bull Market Revival or Cycle Stress Test?
TL;DR
Background: Bitcoin reclaimed the $80,000 level for the first time since late January 2026. Supported by easing geopolitical concerns surrounding U.S.-Iran tensions, record highs in U.S. equities, renewed ETF inflows, and derivatives short covering, BTC continues to consolidate around the $80,000 range.
Why the Breakout Matters: $80,000 is a major psychological level | The level sits near key on-chain cost basis levels | The current rebound reflects a broader repricing across global risk assets.
Macro Backdrop: U.S.-Iran tensions affect oil prices and inflation expectations | U.S. equities hit new highs, supporting broader risk appetite | The upcoming Federal Reserve leadership transition adds further policy uncertainty.
Market Structure: Spot ETF flows have returned to net inflows | Institutional buyers such as Strategy provide structural demand | Derivatives leverage amplifies price volatility.
Sources of Selling Pressure: Long-term holder profit-taking continues to rise | Trapped holders continue to exit on rebounds | ETF and institutional inflows could turn into future liquidity pressure.
Conclusion: Compared with previous cycles, the current market phase appears closer to a post-correction recovery than the early stage of a new bull market. The key question now is whether Bitcoin can establish sustainable support above $80,000 while finding a new balance between institutional demand, on-chain cost bases, and broader macro conditions.
I. Bitcoin Reclaims $80,000: Why This Is More Than a Typical Rebound
On May 4, Bitcoin reclaimed the $80,000 level for the first time since January 31. While this is not a new all-time high, and still remains well below the intraday peak of approximately $126,272 reached on October 6, 2025, its significance lies in the fact that the market has finally returned to a key recovery zone following the sharp correction in the first quarter of 2026.
At first glance, $80,000 may appear to be just another round-number price level. From a market structure perspective, however, it carries at least three important implications.
-
$80,000 as a psychological level: After Bitcoin reached its all-time high in Q4 2025, the market experienced a sharp correction in early 2026, falling to approximately $60,074 on February 6. From peak to trough, BTC underwent a drawdown of more than 50%. The recovery back above $80,000 suggests that Bitcoin has rebounded roughly 30% from its February lows, while market confidence surrounding the continuation of the broader trend has started to stabilize.
-
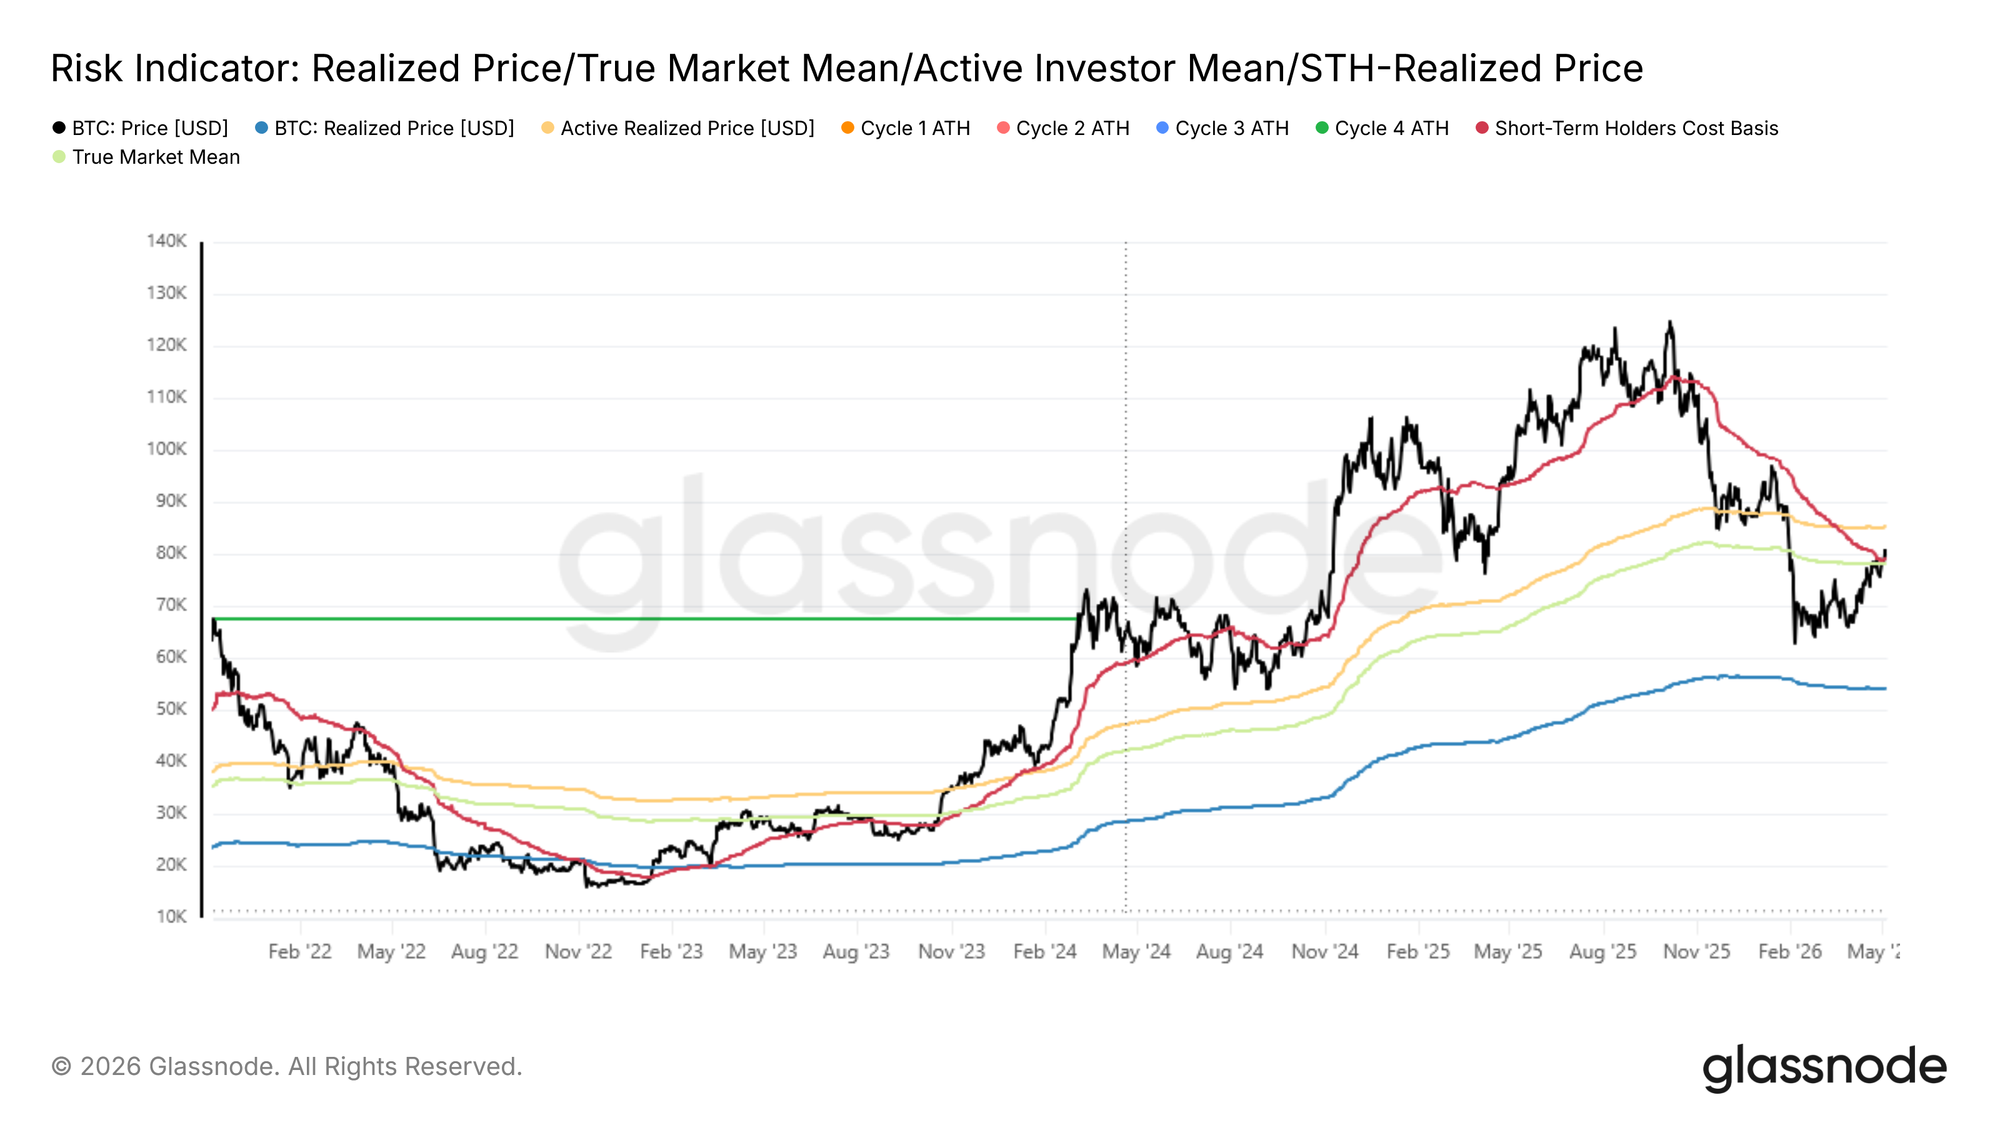
$80,000 as an on-chain cost basis zone: According to Glassnode, Bitcoin’s True Market Mean Price (TMMP) is currently around $78,200, while the short-term holder cost basis sits near $79,100. These metrics represent the average acquisition cost of active circulating supply and investors who accumulated BTC within the past 155 days. Sustained price acceptance above these levels would suggest that previously trapped short-term holders are beginning to recover, allowing the market to transition from a deep-value phase into a broader recovery confirmation phase.
-
A reflection of broader macro repricing: Bitcoin’s latest rebound has not been driven by a single crypto-specific narrative. Instead, it reflects the combined impact of easing geopolitical concerns surrounding U.S.-Iran tensions, record highs in U.S. equities, renewed ETF inflows, and derivatives short covering. In other words, Bitcoin’s return above $80,000 is not an isolated event, but part of a broader repricing across global risk assets.
As a result, Bitcoin’s reclaim of the $80,000 level represents a broader market repricing test. The key questions are whether institutional capital remains willing to continue buying, whether the macro environment can continue supporting risk assets, whether on-chain selling pressure can be absorbed, and whether similar phases in previous cycles can ultimately evolve into sustained upside trends.
II. Macro Environment: U.S.-Iran Tensions, Fed Leadership Transition, and the Repricing of Risk Assets
1. Easing U.S.-Iran Tensions: The Transmission Mechanism Across Oil, Inflation, and Risk Sentiment
One of the most important external variables influencing risk assets recently has been the evolving situation surrounding U.S.-Iran relations and the Strait of Hormuz. On May 5, 2026, U.S. President Trump announced the suspension of the "Freedom Plan" naval escort operation in the Strait of Hormuz to leave room for a potential agreement with Iran, although U.S. restrictions on Iranian ports remain in place. Media outlets including AP and Al Jazeera noted that these developments are closely tied to ceasefire negotiations and the potential normalization of shipping activity through the strait.
The impact of this development on Bitcoin is not straightforward. In the short term, if markets interpret the easing of U.S.-Iran tensions as reducing geopolitical risks, lower oil prices and softer inflation expectations could help improve overall risk appetite, supporting risk assets. Brent crude has already declined from approximately $114 to around $98.5, while easing energy pressures have helped U.S. equities remain near recent highs.
Over the medium to longer term, however, the U.S.-Iran situation is likely to remain a major source of volatility. If tensions surrounding the Strait of Hormuz escalate again, rising oil prices could feed back into inflation expectations, Treasury yields, and consumer spending pressures, ultimately affecting broader risk assets. For Bitcoin, this creates two very different potential market narratives. On one side, BTC could be viewed by some investors as an alternative asset during periods of geopolitical stress. On the other hand, larger institutional investors may continue treating Bitcoin as a high-beta risk asset, exposing it to selling pressure during periods of rising U.S. yields, a stronger dollar, and higher oil prices. So far, Bitcoin’s behavior during the current U.S.-Iran situation has aligned more closely with the latter. Rather than trading purely as a safe-haven asset, BTC has largely participated in the broader rebound across risk assets, supported by declining oil prices, strong performance in technology equities, and recovering ETF inflows.
2. U.S. Equities Reach New Highs: Recovering Risk Appetite Provides External Support for BTC
An important backdrop behind Bitcoin’s return to $80,000 is that U.S. equities have not materially weakened despite ongoing geopolitical uncertainty. Instead, markets have continued to push higher, supported by AI-related themes, semiconductor strength, and resilient corporate earnings. Stronger-than-expected earnings from semiconductor companies such as AMD reinforced market confidence in the broader AI infrastructure cycle. On May 1, the S&P 500 closed at 7,230.12, while the Nasdaq finished at 25,114.44, with both indices reaching new closing highs and extending gains for a sixth consecutive week.
Earlier this year, one of the market’s main concerns was whether Bitcoin had shifted from a high-beta cyclical asset into a liquidity-driven selloff target during periods of tightening financial conditions. However, as U.S. equities continued reaching new highs, semiconductor stocks rallied, and Asian equity markets approached historical highs, institutional investors became more willing to reallocate toward higher-beta assets. Bitcoin’s return above $80,000 therefore reflects more than just a crypto-native recovery. It also signals a broader recovery in global risk appetite.
That said, if U.S. equities shift from a fundamentally driven rally into a valuation-driven correction, BTC could also face renewed pressure. Especially as discussions surrounding overheating valuations in AI and semiconductor sectors continue to grow, Bitcoin’s next phase higher cannot rely solely on external risk appetite. More sustainable spot demand and stronger on-chain structural support will also be required.
3. Federal Reserve Leadership Transition: The Policy Expectation Window Is Not a One-Way Bullish Catalyst
Another major macro variable is the upcoming leadership transition at the Federal Reserve. Powell’s term as Fed Chair is scheduled to end in mid-May 2026. Kevin Warsh has already passed the Senate Banking Committee process and is awaiting further confirmation, while Powell has indicated that he intends to remain on the Federal Reserve Board through 2028 after his chairmanship ends.
Markets generally view Warsh as potentially more aligned with the Trump administration’s policy preferences. However, that does not necessarily imply an immediate shift toward rate cuts. According to Barron’s analysis of Warsh’s policy framework, he may prefer to keep rates unchanged through the summer while waiting for greater clarity on energy prices and inflation trends, alongside potential adjustments to the Fed’s communication strategy and inflation assessment framework.
The Federal Reserve leadership transition affects Bitcoin through three main channels:
-
Rising policy uncertainty: Markets may need to reprice expectations surrounding Federal Reserve independence, inflation tolerance, the pace of future rate cuts, and balance sheet policy.
-
Potential short-term support for risk assets: If investors believe Warsh could lean more dovish in the second half of the year, BTC, technology equities, and other high-beta assets may begin pricing in liquidity expectations in advance.
-
More complex policy risks if inflation rebounds: If inflation pressures return because of rising oil prices or tariffs, the leadership transition could instead introduce more complicated policy conflicts. In that scenario, Bitcoin may face a renewed tug-of-war between rate-cut expectations and inflation risks.
As a result, Bitcoin’s move above $80,000 remains within a broader policy validation window ahead of mid-May. Markets are still waiting for greater clarity from the incoming Fed leadership, June FOMC expectations, energy prices, and inflation data before establishing a more definitive direction.
III. Market Structure: Institutional Buying, ETF Inflows, and Leverage Amplification
1. ETF Inflows Reemerge as the Core Source of Spot Demand
Source: https://studio.glassnode.com/charts/institutions.UsSpotEtfFlowsNet
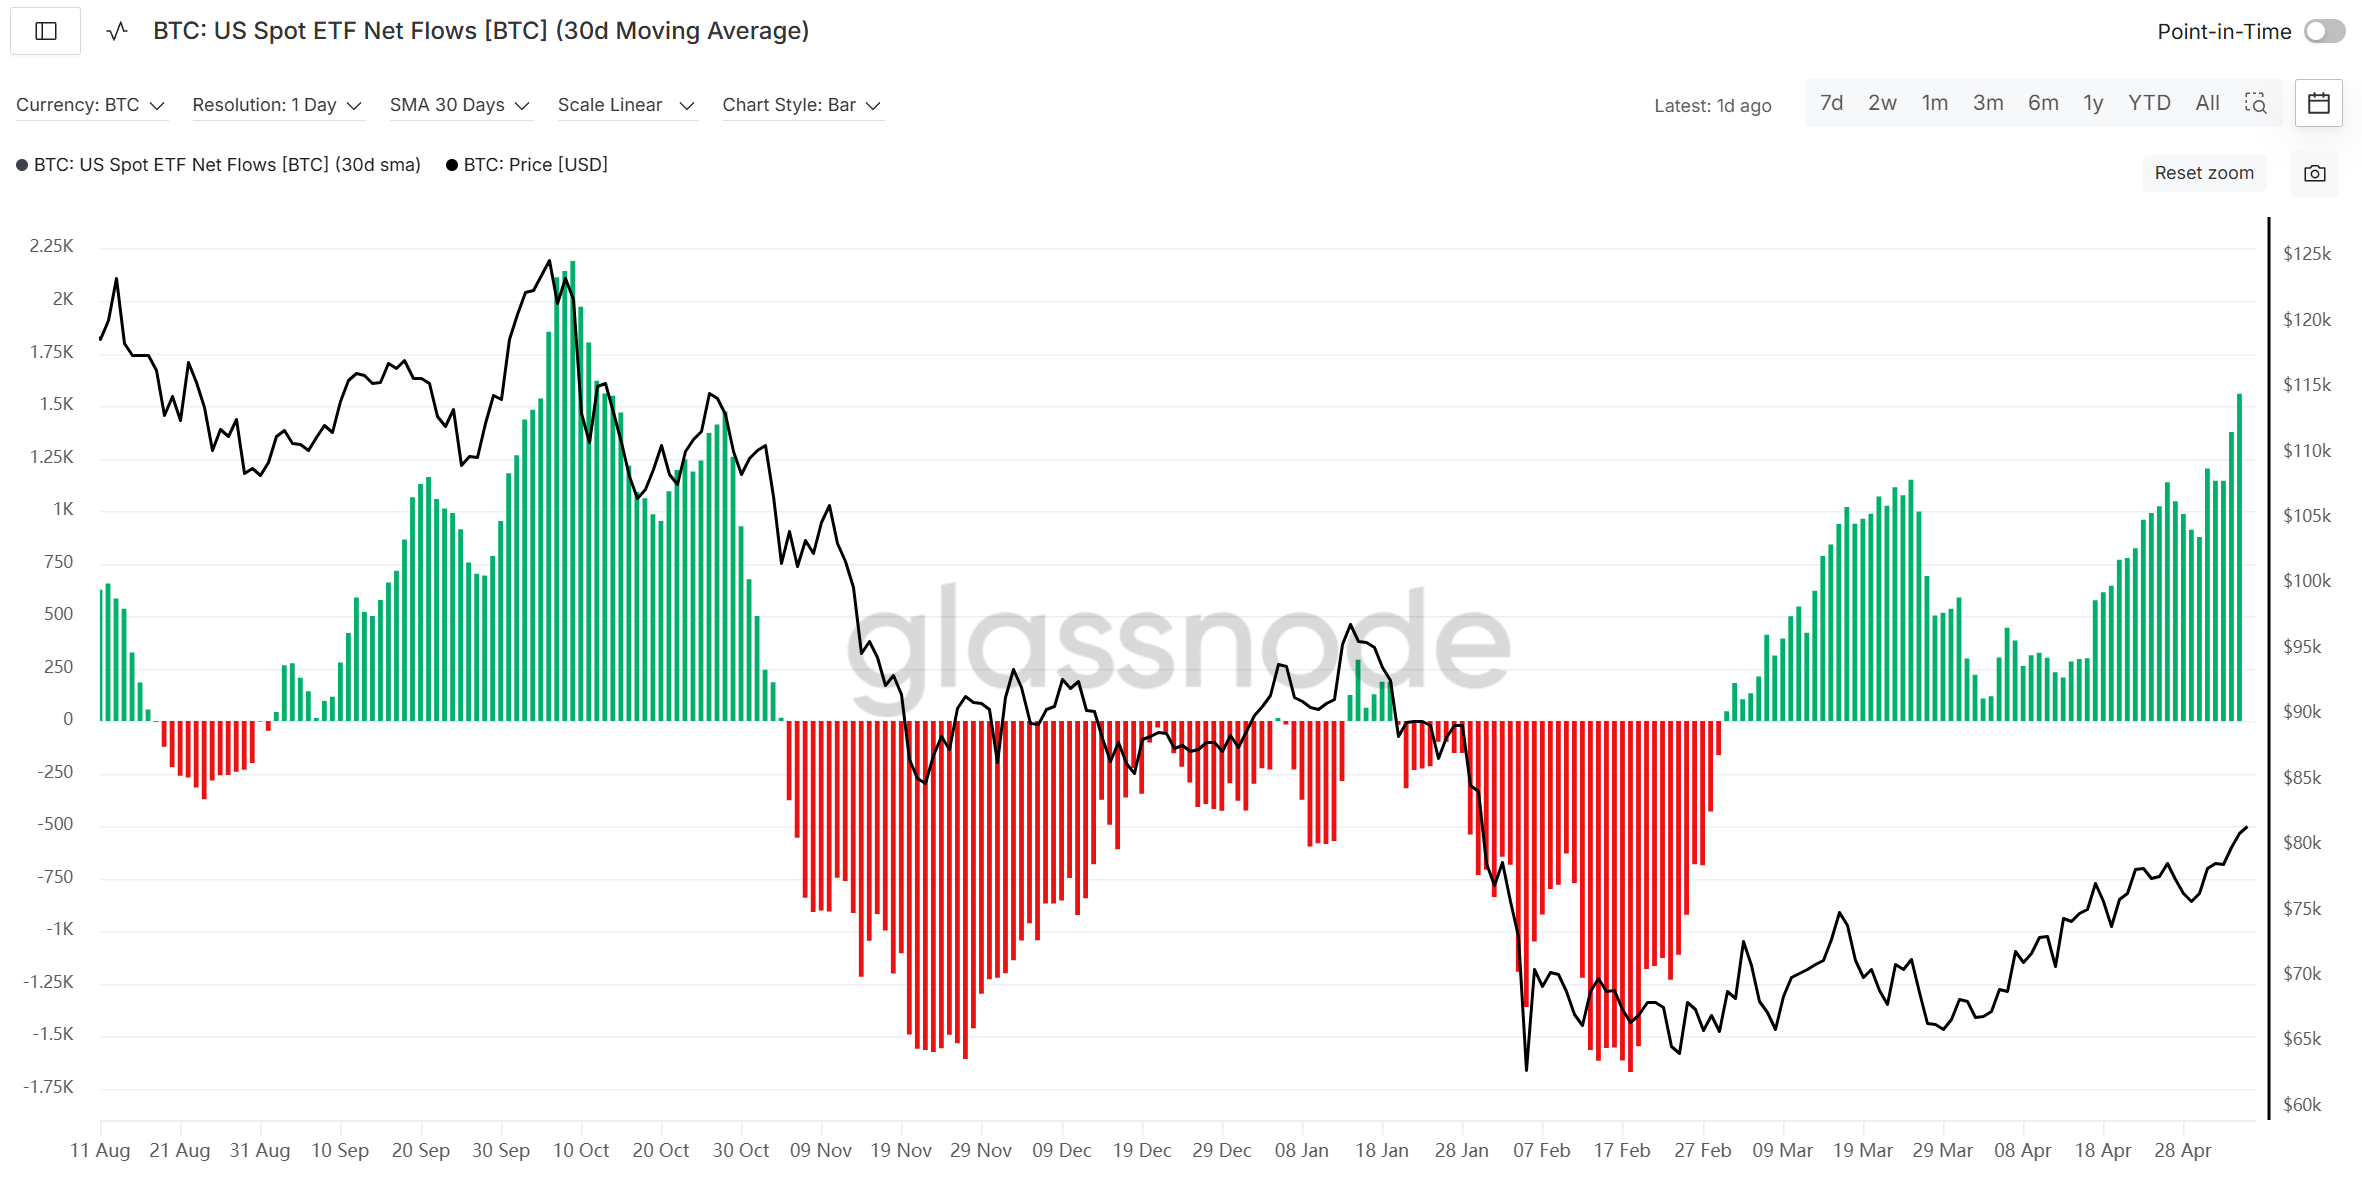
Unlike the market cycles of 2017 and 2021, the biggest structural shift in Bitcoin’s market in 2026 is that spot ETFs have become the primary channel for institutional capital entering BTC. According to Glassnode data, U.S. spot Bitcoin ETFs recorded approximately $2.44 billion in net inflows during April 2026, marking one of the strongest monthly performances of the year. Inflows also remained strong in early May, indicating that ETF capital flows have shifted meaningfully from the outflows seen in the first quarter back toward sustained net inflows.
This helps explain why Bitcoin’s move back above $80,000 looks more like institutional reallocation than retail-driven FOMO. ETF demand has several defining characteristics: it is generally more stable, more transparent, more sensitive to macro risk appetite, and more capable of reinforcing the cycle between rising prices and continued capital inflows. However, this structure also introduces vulnerabilities. If U.S. equities correct sharply, Federal Reserve expectations turn more hawkish, or BTC falls back below key cost basis levels, ETF inflows could weaken or reverse into redemptions. As a result, ETF inflows remain the core source of support behind this breakout. Whether these inflows can continue will likely become the primary variable determining whether the $80,000 level can transition from resistance into sustainable support.
2. Institutional Buying Provides Structural Demand While Introducing New Risks
Beyond ETFs, purchases by listed companies and institutional treasury entities remain another important source of Bitcoin demand. Strategy’s Q1 2026 earnings report, released on May 5, showed that the company held 818,334 BTC, representing a 22% increase in holdings year-to-date, with an average acquisition cost of approximately $75,537. At the same time, the company raised roughly $11.68 billion through capital markets activities during the same period. This type of institutional buying continues to provide meaningful structural support for the market. Strategy’s holdings now account for approximately 3.9% of Bitcoin’s eventual total supply, reinforcing the broader narrative of Bitcoin as an institutional treasury asset while also strengthening long-term demand expectations across secondary markets.
However, this structure also introduces additional risks. Strategy is no longer simply a company accumulating Bitcoin directly. Instead, it has built an increasingly complex capital structure involving common stock, preferred shares, convertible bonds, and other financing instruments. Its latest earnings report showed approximately $14.5 billion in unrealized digital asset losses during Q1 due to Bitcoin’s fair-value decline. This does not necessarily imply that Strategy will become a major source of near-term selling pressure. However, it does highlight a deeper structural shift within Bitcoin’s market. Institutional participation does not only provide structural demand. It also ties Bitcoin more closely to traditional capital market volatility, financing conditions, and balance sheet management dynamics.
3. Derivatives Help Drive the Breakout While Amplifying Downside Risk
Source: https://insights.glassnode.com/the-week-onchain-week-18-2026/
Another defining feature of Bitcoin’s move back above $80,000 has been the elevated level of participation in derivatives markets. Throughout the recent rebound, perpetual futures funding rates have remained mostly negative, suggesting that a significant number of short positions still exist in the market. This type of positioning can easily trigger short covering once prices break through key resistance levels.
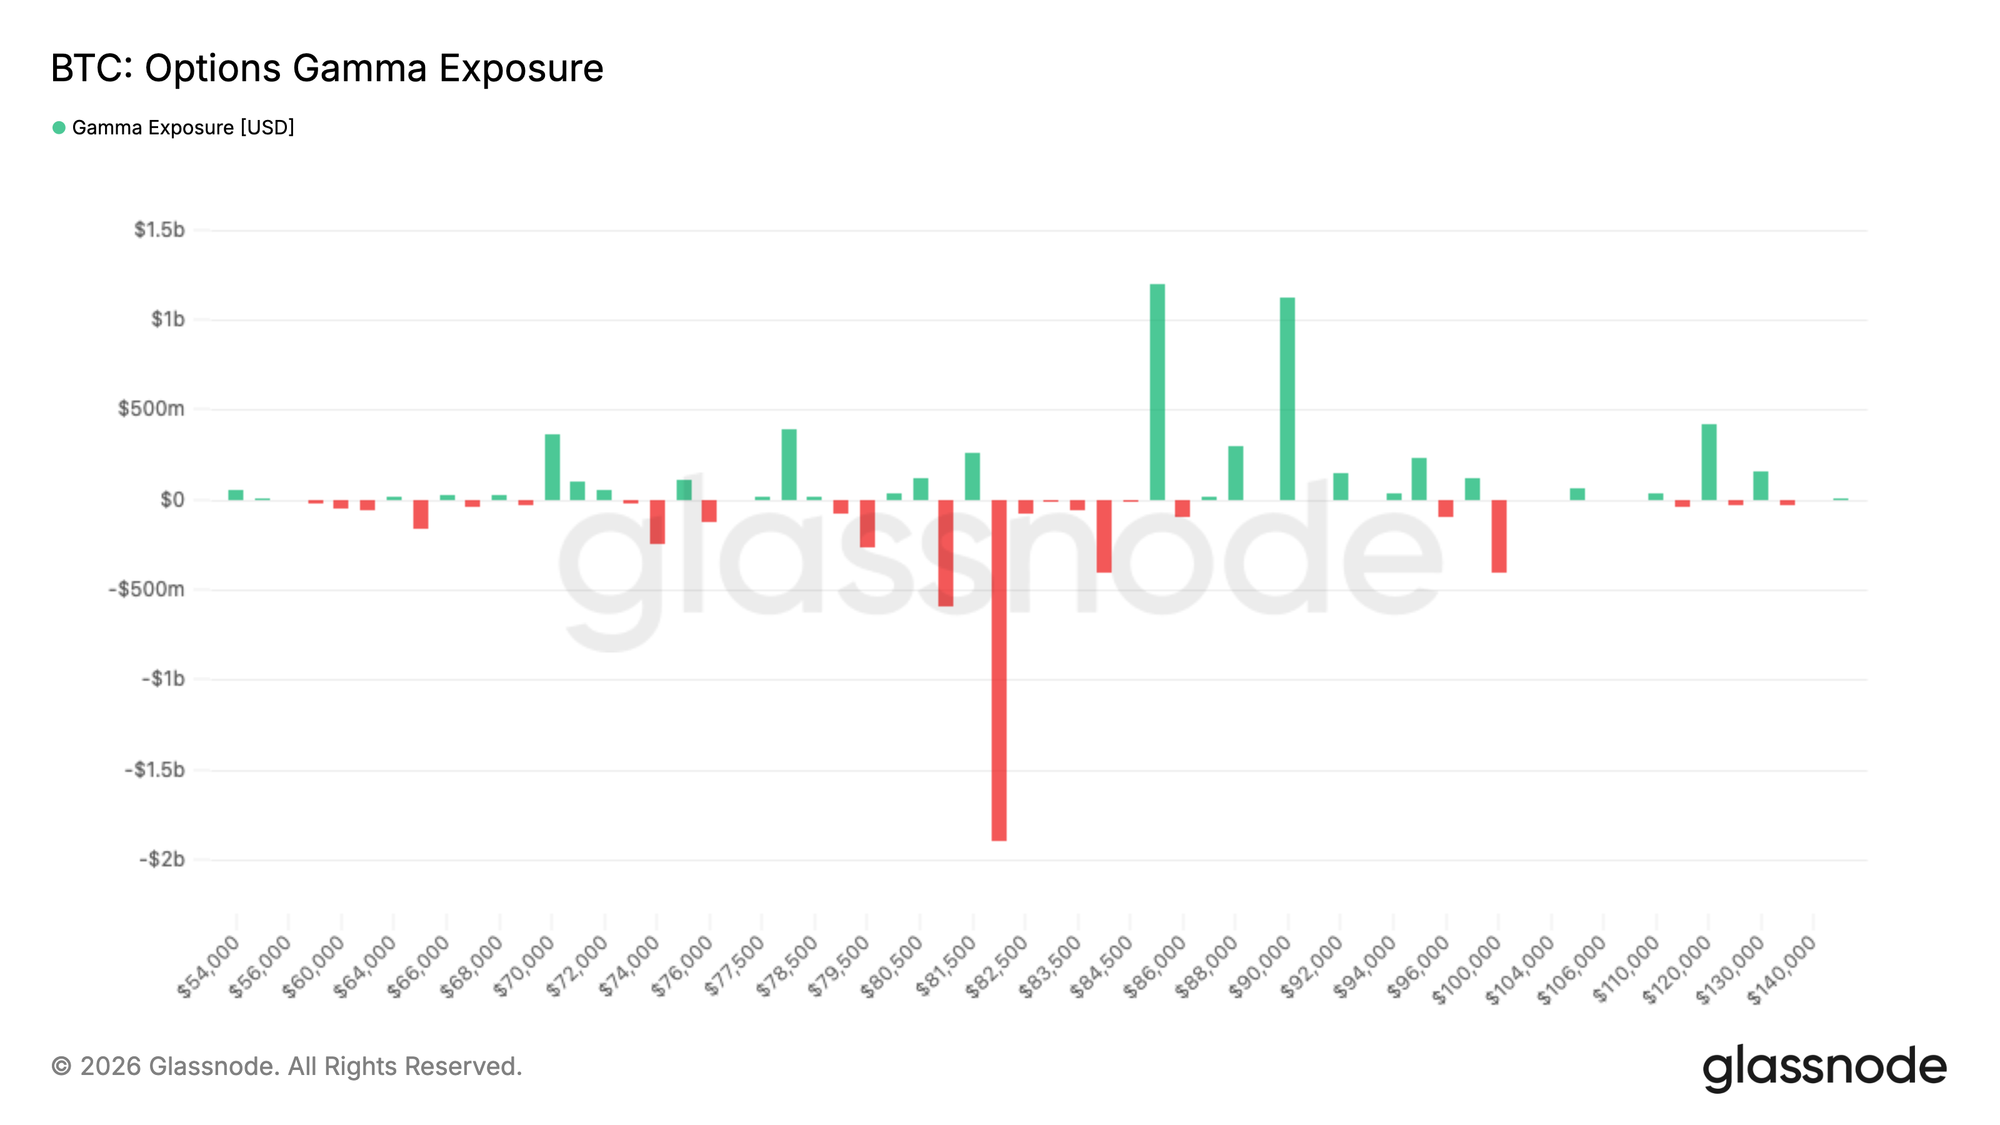
Options markets are also contributing to higher volatility. According to Glassnode data, nearly $2 billion in short gamma exposure is concentrated around the $82,000 level.
A short gamma environment means market makers are forced to buy as prices rise and sell as prices fall in order to maintain hedged positions, which can further amplify directional price movements. This helps explain why BTC could experience both rapid upside acceleration near $80,000 and sharp pullbacks if the level fails to hold.
Overall, the buying flows behind Bitcoin’s breakout above $80,000 can be divided into three categories:
-
ETF inflows, which represent relatively stable spot demand
-
Institutional treasury buying, which provides structural demand
-
Derivatives short covering and gamma-related trading activity, which function more as volatility amplifiers
If future upside momentum is primarily supported by ETF inflows and spot demand absorption, Bitcoin is more likely to establish sustainable support above $80,000. However, if the rally relies mainly on leverage expansion and short covering, the move above $80,000 could prove to be a temporary breakout rather than the beginning of a sustained expansion phase.
IV. Sources of Selling Pressure: Where Does the Real Resistance Above $80,000 Come From?
The True Market Mean Price and the short-term holder cost basis previously acted as major overhead resistance zones for BTC. Now that these levels have been reclaimed, they should theoretically begin transitioning into support. If BTC can maintain price acceptance within the $78,200-$79,100 range over the coming days, it would suggest that the deep-value phase that began in February may have largely ended.
However, that does not mean selling pressure has disappeared. The next major resistance level sits near the Active Realized Price around $85,200. This metric represents the cost basis of economically active supply and reflects the broader average entry level of active market participants. In other words, $80,000 is only the first key level. The $84,000-$85,000 range is likely to become the key resistance zone determining whether the market can truly transition from a recovery phase into a renewed uptrend.
1. Long-Term Holder Profit-Taking Is Rising, Though Not Yet at Extreme Levels
Source: https://insights.glassnode.com/the-week-onchain-week-18-2026/
The first major source of selling pressure comes from long-term holders. According to Glassnode data, the 14-day moving average of realized profits from supply held for more than one year has risen to approximately $180 million per day. This suggests that as Bitcoin approaches levels above $80,000, early low-cost holders have started realizing portions of their gains.
Profit distribution by long-term holders is not unusual during bull markets. The key question is whether buy-side liquidity remains strong enough to absorb that supply. If ETF inflows, institutional allocation, and spot demand can continue absorbing long-term holder selling in the range of $100-$200 million per day, BTC may still maintain a relatively stable upward trajectory. However, if ETF inflows begin slowing while long-term holder distribution continues increasing, the area around $85,000 could gradually evolve into a medium-term resistance zone.
2. Realized Losses Remain Elevated as Trapped Holders Continue Exiting on Rebounds
The second major source of selling pressure comes from investors still holding underwater positions. According to Glassnode data, the 14-day moving average of total realized losses currently stands at approximately $479 million per day, roughly 140% above the cycle’s baseline level of around $200 million per day during more stable market conditions. This suggests that even after rebounding from the $60,000 lows, a meaningful portion of market participants continue choosing to exit positions as losses narrow.
This type of selling pressure tends to be more sensitive to market conditions. Long-term holder distribution is typically driven by gradual profit-taking and often unfolds relatively slowly. By contrast, trapped holders exiting during rebounds are more likely to sell aggressively once prices encounter resistance. If BTC fails to break through the $84,000-$85,000 range, short-term participants and previously trapped holders may begin selling again, potentially pushing prices back toward the $78,000-$80,000 cost basis zone.
3. Institutional Buying and ETF Redemption Risk Could Eventually Turn Into Liquidity Pressure
The third potential source of selling pressure comes from capital flows themselves. As long as ETF inflows remain positive, the market may continue absorbing new miner supply, long-term holder profit-taking, and selling from previously trapped holders exiting on rebounds. However, if ETF flows shift from inflows back into outflows, the structural support that previously helped drive the rebound could quickly become a source of downside pressure.
At present, ETFs have become one of the market’s primary price discovery channels for Bitcoin. Net inflows of roughly $2.0-$2.4 billion during April played a major role in supporting the latest rebound. Historical experience, however, suggests that ETF flows remain highly sensitive to broader macro conditions. If U.S. equities weaken, the dollar strengthens, oil prices push inflation expectations higher, or Federal Reserve expectations turn more hawkish, ETF inflows could contract rapidly. In that scenario, BTC would face not only on-chain selling pressure, but also rebalancing pressure from traditional institutional capital flows.
V. Historical Cycle Comparison and Forward Outlook
1. Historical Cycle Comparison: The Current Phase Resembles a Post-Correction Recovery More Than the Beginning of a New Bull Market
Throughout Bitcoin’s historical cycles, rebounds of 20%-40% following major drawdowns have not been uncommon. During the 2017 cycle, BTC experienced multiple pullbacks of roughly 30%, yet the broader trend was able to continue as long as price reclaimed key moving averages and major cost basis zones. The 2021 cycle proved more complex, with Bitcoin experiencing a sharp decline in the first half of the year before staging a secondary rally that ultimately formed a double-top structure. What ultimately determines the nature of a market cycle is not whether price breaks through a round-number level in a single session, but whether BTC can sustainably hold above key cost basis zones while maintaining sufficient spot demand as overhead supply gradually gets distributed.
-
The current 2026 phase shares several similarities with previous cycles. Bitcoin still exhibits many classic characteristics of a cyclical asset: sharp drawdowns from elevated levels, panic-driven deleveraging, competition around major cost basis zones, gradual long-term holder distribution, and short-term holder cost bases acting as key dividing lines between bulls and bears. The rebound from approximately $60,000 in February back toward $80,000 is, in many ways, a repricing recovery within a broader post-bull-market structure.
-
The key difference, however, is that ETFs and institutional capital have fundamentally changed Bitcoin’s supply-demand dynamics. The 2017 cycle was driven primarily by retail participation and exchange-driven liquidity. By 2021, institutional investors and listed companies had begun entering the market, although spot ETFs had not yet become the dominant capital channel. The structure of the 2026 market is very different. ETF flows, institutional treasury allocation, options gamma positioning, and listed-company capital structures are now collectively influencing BTC price behavior. The market has become more mature, but also significantly more financialized.
As a result, traditional frameworks such as “post-halving rallies inevitably continue higher” or “historical cycles must eventually make new highs” may no longer fully apply. The current environment more closely resembles an institutional reallocation phase following a major drawdown. If ETF inflows continue, on-chain realized losses compress, and the $85,200 resistance zone is decisively reclaimed, the market could transition from a recovery phase into a renewed higher-cycle uptrend. However, if macro risks rise again, ETF inflows weaken, and selling pressure around $85,000 cannot be absorbed, Bitcoin’s move back above $80,000 may ultimately prove to be a medium-term rebound rather than the beginning of a new expansion phase.
2. Forward Scenario Analysis: What Comes After $80,000?
(1) Bullish Scenario: Holding Above $80,000 and Clearing $85,000 Could Open the Path Toward $90,000
Under a bullish scenario, Bitcoin would likely need to satisfy three conditions.
First, price needs to maintain support within the $78,200-$79,100 cost basis zone, allowing the True Market Mean and short-term holder cost basis levels to shift from resistance into support. Second, ETF inflows would need to remain positive, with daily spot demand strong enough to absorb roughly $180 million per day in long-term holder profit-taking and selling from trapped holders exiting on rebounds. Third, BTC would need to decisively break above the $85,200 Active Realized Price zone and maintain sustained closes above that level.
If these conditions are met, $80,000 could evolve from a psychological level into a stronger medium-term support level, potentially opening the way for a retest of the $90,000 range. At that stage, the broader market narrative could also shift from a “post-decline rebound” toward a renewed continuation of the higher-cycle trend.
(2) Neutral Scenario: Consolidation Between $78,000 and $85,000 While Waiting for Macro Clarity
The neutral scenario arguably aligns more closely with the market’s current condition. Bitcoin has regained institutional support, but still faces elevated realized losses on-chain, rising long-term holder distribution, and uncertainty surrounding the Federal Reserve leadership transition. Under this scenario, BTC could continue fluctuating within the $78,000-$85,000 range.
Such consolidation would not necessarily be negative for the market. A prolonged range could help absorb short-term profit-taking, allow trapped holders to gradually exit, and give ETF inflows more time to continue absorbing available market supply. At the same time, markets would gain additional clarity around U.S.-Iran developments, oil prices, Warsh’s policy path, and expectations for the June FOMC meeting. If realized losses gradually compress from the current ~$479 million per day level while ETF inflows remain positive, this consolidation phase could ultimately provide a stronger foundation for the next major breakout.
(3) Risk Scenario: A Breakdown Below $78,000 Could Lead to a Retest of the $72,000-$75,000 Range
Under the risk scenario, several potential catalysts could pressure the market simultaneously.
U.S.-Iran negotiations could deteriorate again, causing renewed tensions around the Strait of Hormuz, higher oil prices, and rising inflation expectations. U.S. equities could also face corrections if AI and semiconductor valuations become increasingly stretched, triggering broader deleveraging across risk assets. In addition, markets could reassess overly optimistic rate-cut expectations if Warsh’s policy stance proves less dovish than anticipated. ETF inflows could weaken or even reverse into outflows, while BTC may fail to decisively break through the $85,000 resistance zone.
If BTC falls back below the $78,200-$79,100 cost basis zone, it would suggest that the latest breakout has failed to convert previous resistance into sustainable support. In that case, BTC could revisit the $75,000 or even $72,000 region. Under more extreme conditions, simultaneous pressure from both equities and oil markets could potentially push Bitcoin back toward the $70,000 support area.
VI. Conclusion: $80,000 Is Not the Destination, but the Beginning of a Repricing Test
Bitcoin’s return above $80,000 is an important signal, but not a final confirmation. It suggests that the market has largely recovered from the panic-driven lows seen in February. ETF inflows and institutional capital have returned, while key on-chain cost basis zones have also been reclaimed. At the same time, improving risk appetite has been supported by record highs in U.S. equities and easing geopolitical concerns surrounding U.S.-Iran tensions. Even so, the market is entering a far more important validation phase.
From a broader perspective, Bitcoin is gradually transitioning from a high-volatility narrative-driven asset into a more institutionalized risk asset. This means its long-term market structure may be becoming more mature, but it also means BTC is increasingly influenced by macro conditions, equity markets, interest rate expectations, and institutional capital flows.
As a result, $80,000 should not be viewed as a definitive bull market confirmation level, but rather as a repricing test zone. The market now needs to determine whether Bitcoin can establish a new support structure across institutional capital, on-chain cost bases, and broader macro risks.
In the short term, the key question is whether BTC can maintain support above $80,000 and eventually clear the $85,200 resistance zone. Over the medium term, the sustainability of ETF inflows, the compression of realized losses, and the market’s ability to absorb long-term holder selling pressure will determine whether Bitcoin resumes a broader uptrend or returns to a wider consolidation range.
For investors, the real focus should not simply be whether BTC breaks through a particular price level in a single day, but whether the underlying quality of capital flows, selling pressure dynamics, and the broader macro pricing environment are genuinely improving behind the move.
About Us
Hotcoin Research, the core research and investment arm of Hotcoin Exchange, is dedicated to turning professional crypto analysis into actionable strategies. Our three-pillar framework—trend analysis, value discovery, and real-time tracking—combines deep research, multi-angle project evaluation, and continuous market monitoring.
Through our Weekly Insights and In-depth Research Reports, we analyze market dynamics and highlight emerging opportunities. With Hotcoin Selects—our exclusive dual-screening process powered by both AI and human expertise, we help identify high-potential assets while minimizing trial-and-error costs.
We also engage with the community through weekly livestreams, decoding market hot topics, and forecasting key trends. Our goal is to empower investors of all levels to navigate cycles with confidence and capture long-term value on Web3.
Risk Disclaimer
The cryptocurrency market is highly volatile, and all investments carry inherent risks. We strongly encourage investors to remain informed, assess risks thoroughly, and adhere to strict risk management practices to protect their assets.
Connect with Us
Website:https://www.hotcoin.com/en_US/learn/index/
X: x.com/HotcoinAcademy
Email: labs@hotcoin.com
読書をお勧めします
もっと見る
Hotcoin Research | Playing and Earn in WEB3: A Comprehensive Analysis of Matr1x—The Rise of a New Giant in Web3 Gaming
In-depth Research

Hotcoin Research | Rebrand or Reinvention? Inside MakerDAO’s Transformation into Sky
In-depth Research

Hotcoin Research | Disrupting Traditional Token Unlocking Models: How Gabby World’s Fair Release Mechanism is Reshaping GameFi Token Economics
In-depth Research

サービス連絡先
Service@hotcoin.com
製品フィードバック
Product@hotcoin.com
ビジネス協力
Business@hotcoin.com
法務連絡先
Casecn@hotcoin.com
©2017-2026