Apple (AAPL) Stock Price | Live Chart, Market Cap and FAQs
AAPL is the ticker for Apple Inc.'s common stock listed on Nasdaq. The live price and market cap on the page should be fed by the latest market data and change continuously with trading, so a figure at any single moment should not be treated as a long-term conclusion.
To read this stock, first separate product revenue from services revenue, then look at product lines such as iPhone, Mac, iPad and Wearables, and finally return to the quote page to understand price and market cap.
Key Takeaways
- AAPL is Apple's Nasdaq-listed common stock ticker. The company is headquartered in Cupertino, California, and its fiscal year typically ends in late September.
- The company splits net sales into Products and Services; within Products it reports iPhone, Mac, iPad and Wearables, Home and Accessories.
- Gross margin was 47.9% in FY2026 Q4, and the company said about 1 percentage point came from a favorable tariff refund; roughly $0.05 of diluted EPS was also related to that refund, so 47.9% should not be treated as a normal gross margin.
- The live chart reflects exchange trading. Regular trading hours are 9:30–16:00 New York time; pre-market and after-hours prices are not the official closing price.
- Market cap is generally estimated as "share price × shares outstanding." It is not cash on the company's books, nor does it mean all shares could be sold at the displayed price.
What is Apple? Where is AAPL listed?
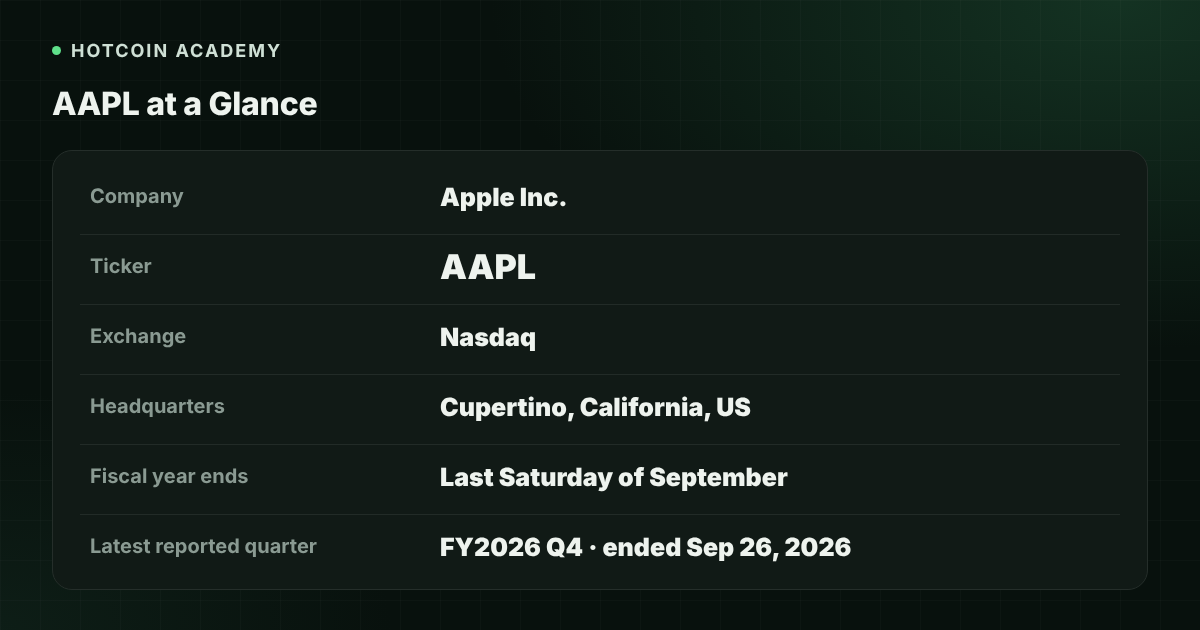
Apple is a technology company headquartered in Cupertino, California, with hardware including iPhone, iPad, Mac, AirPods, Apple Watch and Apple Vision Pro, and services including the App Store, Apple Music, iCloud, Apple Pay and Apple TV. Its stock is listed on Nasdaq under the ticker AAPL. The company's fiscal year typically ends on the last Saturday of September.
| Item | Details |
|---|---|
| Company name | Apple Inc. |
| Ticker | AAPL |
| Exchange | Nasdaq |
| Headquarters | Cupertino, California, US |
| Fiscal year end | Typically late September |
| Latest reported quarter | FY2026 Q4, ended September 26, 2026 |
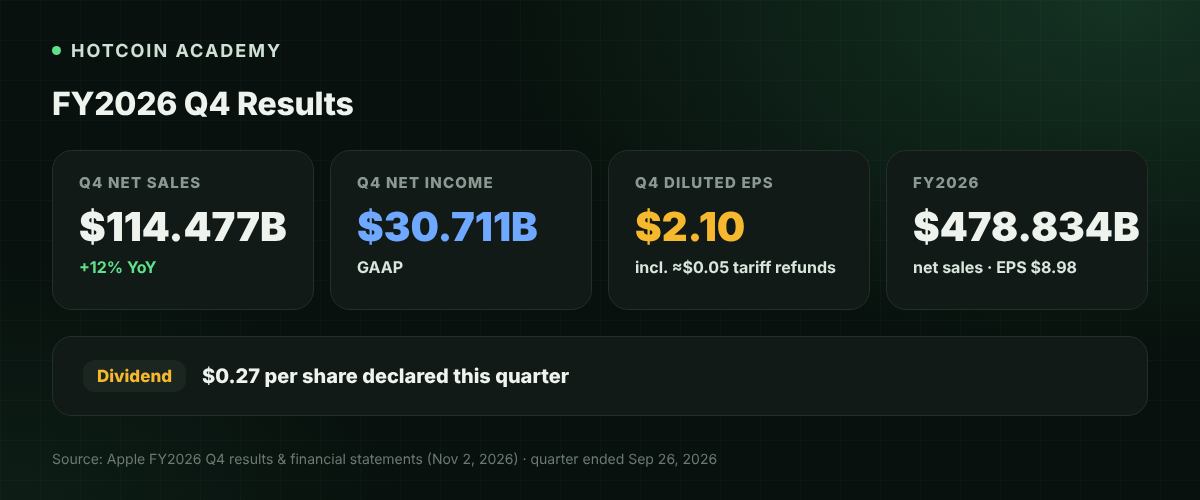
According to Apple's FY2026 Q4 results release published on November 2, 2026, and the accompanying financial statements, quarterly net sales were $114.477 billion, up 12% year over year; net income was $30.711 billion and diluted EPS was $2.10. Full-year FY2026 net sales were $478.834 billion and diluted EPS was $8.98. The company said gross margin for the quarter was 47.9%, with about 1 percentage point from a favorable tariff refund; roughly $0.05 of diluted EPS was also related to that refund. These figures come from the company's published release and will be updated in later quarters; please refer to the latest filings.
What businesses drive Apple's revenue now?
In its income statement, Apple first splits net sales into Products and Services, then provides additional disclosure by product category and by region. The FY2026 Q4 and full-year composition is as follows:
| Category | FY2026 Q4 | FY2026 Full Year |
|---|---|---|
| Products | $82.904 billion | $355.533 billion |
| Services | $31.573 billion | $123.301 billion |
| Total net sales | $114.477 billion | $478.834 billion |
The same statements also report net sales by product line; Services is listed separately in the table above, so this table breaks out Products only:
| Product line | FY2026 Q4 | FY2026 Full Year |
|---|---|---|
| iPhone | $57.583 billion | $254.098 billion |
| Mac | $10.792 billion | $37.929 billion |
| iPad | $6.229 billion | $27.929 billion |
| Wearables, Home and Accessories | $8.300 billion | $35.577 billion |
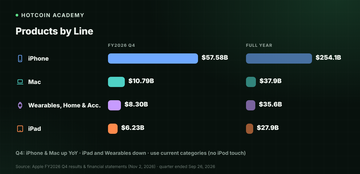
As the figures show, iPhone remains the largest product line for both the quarter and the full year, while Services is the second-largest revenue source after iPhone and a higher-margin business. The company noted that iPhone and Mac grew year over year in the quarter, while iPad and Wearables, Home and Accessories declined, and said some categories were affected by supply constraints or a higher year-over-year base. These breakdowns help explain the revenue structure but cannot be directly converted into a "fair share price." When reading third-party company profiles, note that some pages may still list models no longer reported as current product lines (such as iPod touch). When discussing the current revenue structure, use the product and services categories in the latest earnings release, and the iPhone, Mac, iPad, Wearables, Home and Accessories framework.
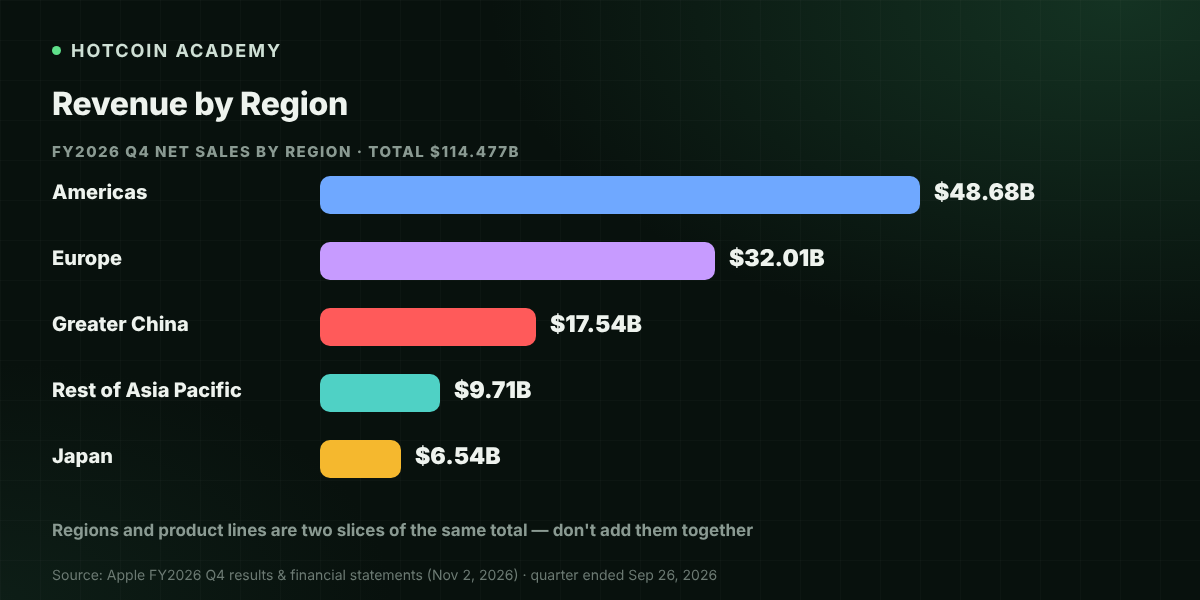
Apple also reports net sales by region. In FY2026 Q4, the Americas were $48.680 billion, Europe $32.008 billion, Greater China $17.539 billion, Japan $6.540 billion and the rest of Asia Pacific $9.710 billion. The regional view and the product-line view are two slices of the same total revenue and should not be added together.
How to read AAPL's live chart
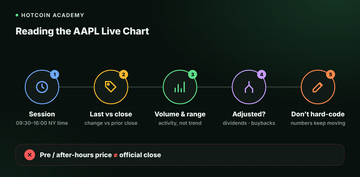
The live chart on a quote page comes from securities market trading. It is best read in these steps:
- Confirm the trading session first: US regular trading hours are 9:30 to 16:00 New York time. The corresponding Beijing time differs by 12 or 13 hours depending on daylight saving time, so rely on the time zone shown on the page.
- Distinguish the latest price from the closing price: The latest price is the most recent trade. Percentage change is usually calculated against the previous trading day's official close. Pre-market and after-hours liquidity is often thin, so these prices should not be treated as a confirmed close.
- Consider volume and the day's high and low: These help judge whether the day's moves are active, but they cannot alone prove that a trend has formed.
- Watch dividends and buybacks: The company continues to pay a cash dividend, declaring $0.27 per share for the quarter. Buybacks and dividends affect share count or shareholder returns, so when comparing long-term price trends, check whether the page uses adjusted prices.
- Rely on the page's real-time data: This article does not hard-code the share price, percentage change or market cap at any moment.
How to read market cap
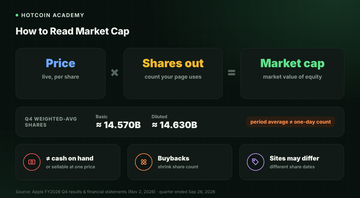
Market cap is generally estimated as follows:
Market cap ≈ current share price × shares outstanding
The share-count basis is as stated on the quote page. In its quarterly financial statements, Apple reported weighted-average shares of about 14.570 billion for basic EPS and about 14.630 billion for diluted EPS. These are period averages, not the shares outstanding at the close on any one day. Continued buybacks reduce the share count, so use the figure the page uses at the time.
When reading market cap, remember: it is not cash on the company's books, and it is not the amount that would be received by selling all shares at once at the displayed price. Different websites may use share counts from different dates, so results can differ slightly.
Common Misconceptions
- "Apple only makes money selling iPhones": iPhone is indeed the largest product line, but Services reached $123.301 billion for FY2026, making it the second-largest revenue source; Mac, iPad and Wearables are also reported separately.
- "A rising services share means hardware no longer matters": Services growth is often tied to a large installed base of devices. Product and revenue structure should be read together, not separated.
- "The latest price I see is today's official close": Only the official close after regular hours ends is typically the basis for calculating the daily change.
FAQ
Q1: On which exchange is AAPL listed? AAPL is the ticker for Apple Inc.'s common stock on Nasdaq. The company is headquartered in Cupertino, California.
Q2: What businesses drive Apple's revenue now? The company splits net sales into Products and Services. In FY2026 Q4, Products were $82.904 billion and Services $31.573 billion; iPhone was $57.583 billion and remained the largest product line. Full-year net sales were $478.834 billion. Gross margin in the quarter was 47.9%, and the company said about 1 percentage point came from a favorable tariff refund, so it should not be treated as a normal level; refer to the company's latest release.
Q3: How is AAPL's market cap calculated? Generally, current share price multiplied by shares outstanding. The weighted-average share count in financial statements is used for EPS and may not equal the share count used on a quote page at any moment; rely on what the page shows.
Q4: Do pre-market or after-hours AAPL prices count as the official close? No. The official close typically corresponds to the end of regular trading hours; extended-hours prices are a separate session.
Q5: Can share price alone tell whether Apple is expensive? No. Share price does not include information on share count, product and services mix, or margins, and cannot by itself be a basis for buying or selling.
Conclusion
AAPL is Apple's ticker on Nasdaq. To read this stock, first separate product revenue from services revenue, check the share of iPhone and other product lines in the latest reported quarter and fiscal year, then return to the quote page to read the live price and market cap. These figures change with the market and share count, so rely on the page's real-time display and the company's latest releases.
If you also want to distinguish what "price" and "market cap" each explain and do not explain, you can start with What are market cap, circulating supply and fully diluted valuation (FDV)?.
Risk disclosure: This article is for educational and informational purposes only and does not constitute investment advice or a recommendation to buy or sell. Financial figures come from the company's published financial statements or earnings releases and may be updated by later filings. US stock prices are highly volatile and may cause partial or total loss of principal. Please rely on the company's latest releases and the real-time data on your page, and make decisions carefully based on your own risk tolerance.
読書をお勧めします
もっと見る