Fibonacci Retracement: Finding Precise Entry Levels
Fibonacci retracement is a technical analysis tool based on the mathematical golden ratio. By marking specific percentage levels across a clear price move, it helps traders identify where a pullback within a trend is most likely to find support or resistance. Think of it as placing a ruler over price action: after a rally or decline, markets rarely move in a straight line. They often give back part of the move before continuing in the original direction. Fibonacci retracement levels help estimate where that retracement may stop.
The Mathematics Behind Fibonacci Retracement
Fibonacci retracement is named after the 13th-century Italian mathematician Leonardo Fibonacci. Its foundation is the Fibonacci sequence: 0, 1, 1, 2, 3, 5, 8, 13, 21, 34, and so on, where each number is the sum of the two before it.
Several ratios that repeatedly appear in nature and financial markets can be derived from this sequence. Dividing one number by the next produces a value that approaches 0.618, the famous golden ratio. Other commonly used ratios include 0.382, obtained by dividing a number by the one two places ahead, and 0.236.
These ratios are expressed as percentages to form the Fibonacci retracement levels commonly used in trading: 23.6%, 38.2%, 50%, 61.8%, and 78.6%. Although 50% is not a strict Fibonacci ratio, it is widely followed because of its psychological significance as the midpoint of a price move.
How to Draw Fibonacci Retracement Correctly
The accuracy of the drawing directly affects the reliability of the analysis. The core rule is to draw in the direction of the trend:
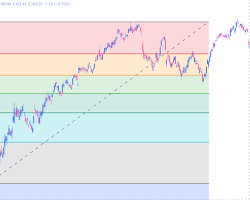
In an uptrend: drag the tool from the swing low, or starting point, to the swing high, or ending point. The retracement levels appear below the high and represent potential support areas during a pullback.
In a downtrend: drag the tool from the swing high, or starting point, to the swing low, or ending point. The retracement levels appear above the low and represent potential resistance areas during a rebound.
The selected swing should be a recent, clear, and significant price move. Avoid ranges that are too small or have no obvious direction.
Key Retracement Levels and What They Signal
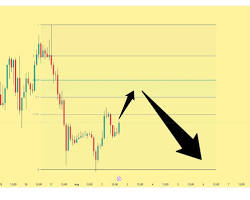
Once the grid is drawn, each horizontal level has a different market implication:
23.6% (shallow retracement): This reflects an exceptionally strong correction. Price gives back less than one-quarter of the move before strengthening again, suggesting powerful momentum in the original trend. However, this level is relatively weak and can be crossed directly in a strong trend.
38.2% (moderate retracement): This is a common pullback depth in a healthy trend. If price finds support here in an uptrend or resistance here in a downtrend, the original trend may still have sufficient momentum. It can serve as a reference for short-term trend-following trades.
50% (psychological midpoint): This is the market's psychological halfway point. Many traders reassess the trend here. Although it is not a strict Fibonacci number, it receives considerable attention in practice.
61.8% (the “golden pocket”): This is the most important Fibonacci level. In a healthy trend, price often retraces to this area before resuming in the original direction. It is regarded as a high-probability zone for buying a pullback or selling a rebound and is a central focus of retracement trading.
78.6% (deep retracement): This is a danger zone. A retracement this deep indicates that the original trend is under pressure, and any rebound may be its final attempt before a reversal. If this level is decisively broken, the original trend is likely to have ended.
Practical Strategy: ETH Limit Order Example
Suppose ETH rises from a low of $3,200 to a high of $3,650 and then begins to pull back. After connecting the $3,200 low to the $3,650 high, the key Fibonacci retracement levels appear as follows:
Trade idea: place a limit order to go long at $3,375–$3,385, around the 0.618 area, set a stop-loss at $3,320, and target a return to $3,600. The strategy offers a reward-to-risk ratio of approximately 3:1.
⚠️ Note: Pullbacks in strong trends are often shallow, around 0.382, while weaker trends or assets may retrace to 0.618 or even deeper. Always assess the current market strength before acting.
Three Practical Principles for Fibonacci Retracement
Principle 1: Trade with the trend instead of trying to catch bottoms or tops against it. Fibonacci retracement is designed to find trend-following entries after a trend has been confirmed. In an uptrend, consider long positions at retracement levels; in a downtrend, consider short positions at rebound levels.
Principle 2: Wait for price-action confirmation rather than placing orders mechanically. Merely touching a Fibonacci level is not an entry signal. Wait for bullish or bearish candlestick patterns, such as a hammer or engulfing pattern, or for an increase in volume before entering.
Principle 3: Confluence zones provide more reliable signals. When a Fibonacci level overlaps with historical support or resistance, a moving average such as the 200 EMA, or a trendline, the strength of that area can increase significantly.
Key Limitations and Risk Warnings
Not a predictive tool: Fibonacci retracement levels are probability-based reference zones, not precise forecasts of turning points. Price may reverse at any level or move straight through every level.
May fail in powerful trends: During an extreme one-way market, price may break through multiple retracement levels without reversing. Traders should not stubbornly enter at predetermined levels in such conditions.
Should be combined with other indicators: Fibonacci retracement is most commonly used with RSI, MACD, volume, and other indicators to provide confirmation from multiple dimensions.
Higher timeframes are more reliable: Fibonacci retracement levels drawn on daily and four-hour charts generally offer more useful reference points than those drawn on 15-minute or one-hour charts.
Frequently Asked Questions (FAQ)
Q1: What is the difference between Fibonacci retracement and Fibonacci extension?
Fibonacci retracement estimates where a pullback may stop by drawing levels inside an existing price move. Fibonacci extension estimates potential targets after a trend breaks beyond that move by drawing levels outside it. Common retracement levels include 23.6%, 38.2%, 50%, and 61.8%, while extension levels often include 138.2% and 161.8%.
Q2: Is a Fibonacci retracement level support or resistance?
It depends on the trend direction. In an uptrend, retracement levels are potential support zones where price may rebound. In a downtrend, they are potential resistance zones where a recovery may stall.
Q3: Why is 0.618, or 61.8%, called the “golden pocket”?
The 61.8% ratio is the golden ratio derived from the Fibonacci sequence. It is the most important and closely watched Fibonacci retracement level. In a healthy trend, price often finds support there during an uptrend or resistance there during a downtrend. Because reversals are considered more likely in this area, traders often call it the golden pocket.
Related tutorials:
Crypto Technical Analysis for Beginners: From Candlesticks to a Trading System
RSI Indicator: A Practical Guide to Overbought and Oversold Signals
Moving Averages Explained: Using MA and EMA to Identify Trends
Volume Analysis: How Price-Volume Relationships Reveal Market Activity
Recommended reading:
Lettura consigliata
Visualizza altro