
How to Use the Hotcoin Calculator to Estimate Trading Returns
What Is the Hotcoin Futures Calculator Used For?
The Hotcoin futures calculator lets you estimate profit or loss, return on investment, a target close price, and a liquidation price before placing an order. It can help you compare different price, position-size, and leverage scenarios.
After entering an entry price, expected close price, position size, and leverage, you can view the estimated P&L and ROI. You can also enter a desired profit amount or ROI to estimate the corresponding target close price. These results are planning estimates and do not represent guaranteed execution outcomes.
The Hotcoin futures calculator includes P&L, close-price, and liquidation-price calculations. Each function requires different inputs, while actual returns may also be affected by execution prices, trading fees, funding rates, and market volatility.
Where Can I Open the Hotcoin Futures Calculator?
First, sign in on the Hotcoin website or open the Hotcoin App, then go to the futures trading page. The calculator is usually located near the futures order panel. It may appear as a calculator icon or inside a feature menu.
Its exact location may vary by web layout, App version, device size, or system language. If the icon is not immediately visible, check above the order panel, at the upper-right of the trading page, or in the More menu.
How Do I Open the Calculator on the Web?
- Sign in: Open the Hotcoin website and sign in to your account.
- Go to futures: Select Futures from the top navigation and choose the contract type you want to trade.
- Open the calculator: Find the calculator icon near the order panel and select it.
- Choose a calculation: Select P&L, close price, or liquidation price in the window.
How Do I Open the Calculator in the App?
- Open the App: Sign in to your Hotcoin account.
- Go to futures: Select Futures in the bottom navigation.
- Find the entry point: Select the calculator icon. If it is not shown directly, check the three-dot menu in the upper-right.
- Open the calculation page: Choose the required calculation and enter the data.
How Do I Calculate Profit or Loss?
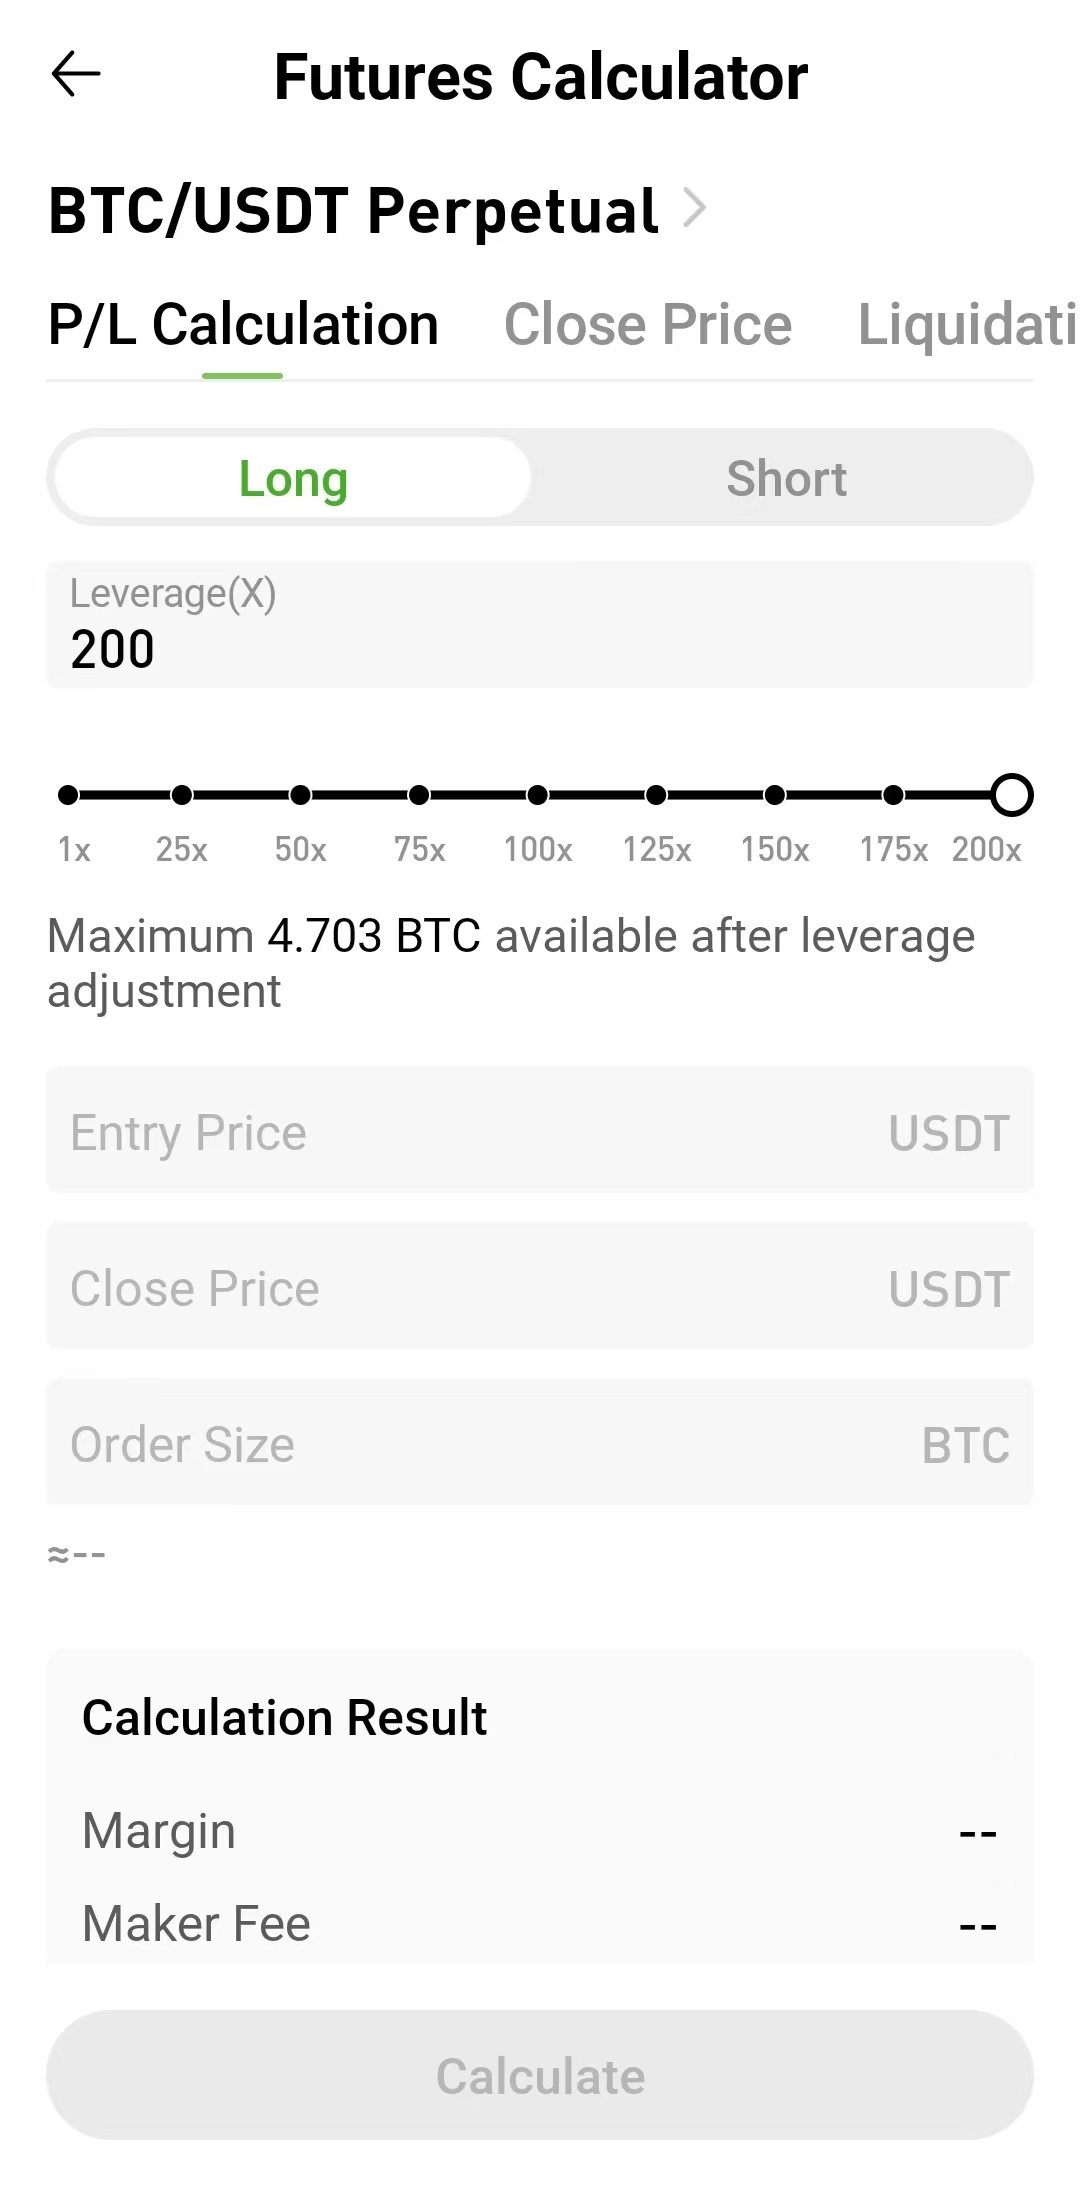
The P&L calculation helps you compare potential profits or losses at different close prices before submitting an order. Choose Long or Short, then enter the average entry price, order size, leverage, and expected close price. The calculator returns an estimated profit or loss and ROI.
Follow these steps:
- Select P&L calculation: Open the calculator and go to the P&L calculation page.
- Choose Long or Short: Select the direction that matches your planned trade.
- Enter the entry price: Use the planned or actual average entry price.
- Enter the close price: Use your expected take-profit or stop-loss price.
- Enter the position size: Check the unit and do not enter account margin in this field.
- Set leverage: Use the same leverage as the planned order.
- Calculate: Review the estimated margin, P&L, and ROI.
How Is P&L Calculated for a Long Position?
For a typical USDT-margined linear contract, the basic relationship is:
Long P&L = (close price − entry price) × position size
If the close price is higher than the entry price, the result is generally a profit. If it is lower, the result is generally a loss. Contracts quoted in lots may also require multiplication by the contract value of each lot.
For a USDT-margined long position, unrealized P&L is commonly based on the difference between the latest mark price and average entry price, multiplied by the contract value and position amount.
How Is P&L Calculated for a Short Position?
The price relationship is reversed for a short position:
Short P&L = (entry price − close price) × position size
When the price falls and the close price is below the entry price, a short position generally earns a profit. When the price rises, it may incur a loss. Always select the correct direction because the sign of the result will otherwise be reversed.
USDT-margined short-position P&L must likewise account for the contract value and position amount where applicable.
How Is Futures ROI Calculated?
Futures ROI usually expresses profit or loss as a proportion of the initial margin, rather than as a proportion of the position's notional value.
ROI = estimated P&L ÷ initial margin × 100%
For example, if a trade has an estimated profit of 20 USDT and uses approximately 60 USDT of initial margin, the estimated ROI is about 33.33% before fees and funding costs.
Leverage reduces the initial margin required to open the same notional position and can therefore increase the displayed ROI. It does not amplify the market's price movement itself. If the price moves against the position, the loss relative to margin also increases more quickly.
How Do I Use the Close-Price Calculation?
The close-price calculation is useful when you have a profit target but do not yet know the price the market must reach. Enter the average entry price, position size, leverage, and desired profit amount or ROI. The calculator estimates the required close price.
- Select close price: Switch the calculation type to Close Price.
- Choose a direction: Confirm whether the position is Long or Short.
- Enter the average entry price: Use the planned or actual average entry price.
- Enter the position size: Use the same unit as the order.
- Set leverage: Match the leverage planned for the order.
- Enter the target: Provide the desired profit amount or ROI.
- Review the result: The calculator displays the estimated close price required to reach the target.
How Do I Use the Liquidation-Price Calculation?
The liquidation-price calculation estimates the price level near which a position may be liquidated. It generally requires the average entry price, position size, leverage, and margin.
- Select liquidation price: Open the liquidation-price calculation page.
- Confirm the direction: Choose Long or Short.
- Enter the average entry price: Use the position's average entry price.
- Enter the position size: Confirm that the unit matches the selected contract.
- Set leverage: Use the actual leverage planned for the order.
- Enter margin: Provide the position margin or added margin as requested on the page.
- Review the liquidation price: Compare the result with your planned stop-loss level.
What Common Mistakes Should I Avoid?
Entering Margin as the Position Size
Margin is the capital committed to the position, while position size is the contract exposure being controlled. Mixing them up distorts P&L, fee, and ROI estimates. Check whether the field uses BTC, ETH, contracts, USDT, or another unit.
Choosing the Wrong Direction
Long and short positions use opposite price relationships. Choosing Short when you expect a rise, or Long when you expect a fall, produces a result that does not match the intended strategy.
Ignoring Fees and Funding Rates
The calculator may primarily display theoretical P&L. Frequent trading, market orders, and long holding periods can make trading fees and funding costs materially reduce net returns, so they should be estimated separately.
Confusing Profit Amount With ROI
A profit of 20 USDT is an amount, while a 20% ROI is profit relative to margin. They are not interchangeable. Before entering a target, confirm whether the calculator expects an amount or a percentage.
Assuming Higher Leverage Always Increases Final Profit
For the same position size, higher leverage mainly reduces initial margin and raises the displayed ROI. It also reduces the room available for adverse price movements. Higher leverage does not change the market's price movement, but it can move the position closer to liquidation.
Treating the Estimate as an Execution Guarantee
The calculator uses the data you enter. Actual trades are affected by market movement, order-book depth, partial fills, slippage, and risk controls. Treat the result as a planning reference, not a promise of final returns.
Frequently Asked Questions
Where Is the Hotcoin Futures Calculator?
After signing in on the Hotcoin website or App, go to the futures trading page and look for the calculator icon near the order panel. If it is not visible, check the upper-right or the More menu. The location may change with App versions, page layouts, or device sizes.
Does the Futures Calculator Include Fees?
Whether fees are displayed directly depends on the fields shown in the current calculator. Even when estimated P&L is provided, final net returns may still be affected by opening and closing fees, funding rates, and slippage. Estimate trading costs separately using the current rates.
Why Does the Estimate Differ From My Actual Return?
Common causes include an actual execution price that differs from the entered price, slippage, partial fills, holding a position through a funding settlement, and differences between estimated and actual fees. The calculator uses static inputs, while real market prices change continuously.
Does Higher Leverage Mean Higher ROI?
When the notional position value stays the same, higher leverage reduces the initial margin and can therefore produce a higher calculated ROI. The same adverse price move also creates a larger loss relative to margin and moves the position closer to liquidation.
How Do I Calculate the Return on a Short Position?
For a USDT-margined linear contract, a simplified short P&L calculation subtracts the close price from the entry price and multiplies the difference by the position size. A price decline generally produces a profit, while a rise generally produces a loss. Contracts quoted in lots may also require the contract value.
Why Is ROI Different From the Asset's Price Change?
The asset's price change compares the close price with the entry price. Futures ROI usually compares trading P&L with the initial margin. Because leverage changes the required margin, the two percentages are often different.
Summary
The Hotcoin futures calculator estimates P&L, ROI, a target close price, and a liquidation price. Enter the trading direction, entry price, close price, position size, leverage, and margin correctly to obtain a useful estimate.
After calculating, include opening and closing fees, funding costs, and slippage when assessing net returns. The calculator can help compare scenarios before an order, but it cannot predict market prices or guarantee execution results.
Get Started
Risk warning: This article explains how to use a trading calculator and does not constitute investment, legal, tax, or financial advice. Digital assets and leveraged futures can be highly volatile, and users may lose some or all of their invested funds. Calculator results are estimates only. Actual P&L, fees, funding costs, and liquidation prices are subject to the Hotcoin trading page, execution records, and current platform rules.
Lettura consigliata
Visualizza altro



Service@hotcoin.com
Product@hotcoin.com
Business@hotcoin.com
Casecn@hotcoin.com