
How to Build Your Own Technical Analysis Trading System
The core of building a technical analysis trading system is turning subjective judgment into a repeatable set of rules built on three pillars: clear entry signals, exit rules, and money management. A complete system is not designed to predict the market. It provides a clear decision framework for price movements, telling you what to do when the market reaches a defined condition instead of leaving you to make an emotional decision in the moment. Quantitative studies show that systematic methods with trend confirmation can achieve win rates of 73.6%–76.0% and profit-to-loss ratios of 1.29–3.22 in major assets. More importantly, systematic execution itself can greatly reduce irrational losses caused by emotional trading.
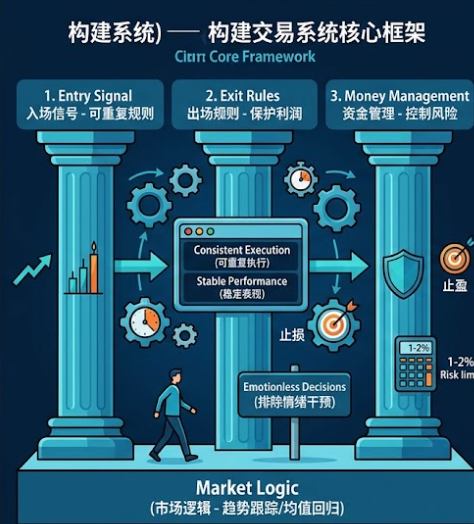
Step 1: Choose Your Trading Timeframe and Core Logic
Before building the system, answer three questions:
How much time can you spend monitoring the market? Short-term trading requires frequent monitoring of price changes on 15-minute or one-hour charts. Swing traders usually focus on four-hour or daily charts, while medium- and long-term traders concentrate on major trends on weekly charts. A day trader's system and a long-term investor's system require very different parameter settings.
How much drawdown can you tolerate? Historical data shows that systems pursuing higher win rates may also experience larger maximum drawdowns. For example, one system's win rate rose from 64.9% to 73.6% while its maximum drawdown increased from 3.83% to 28.20%. Your drawdown tolerance directly affects position size and stop-loss width.
What market logic do you believe in? Is your system based on trend continuation or mean reversion? Trend-following systems profit in directional markets but may be stopped out repeatedly in ranging conditions. Mean-reversion systems perform well in ranges but can suffer severe losses during strong trends. Neither logic is inherently right or wrong, but the system must remain internally consistent.
Step 2: Define Entry Rules—Turn Signals into Conditions
Entry rules are the trading system's trigger and must be clear enough to express in code. Academic literature commonly reduces signal generation to explicit mathematical conditions. For example:
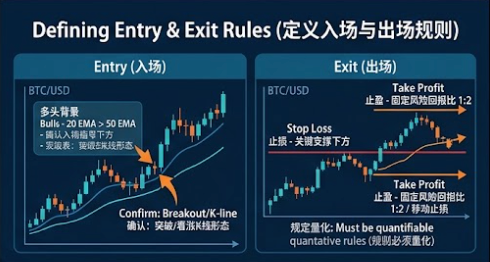
Determine the trend direction: Use moving-average alignment to define the market environment. “When the short-term moving average, such as the 20 EMA, is above the medium-term moving average, such as the 50 EMA, and both are rising, the market is in a bullish environment.”
Set the entry trigger: In a bullish environment, open a position when price breaks above recent resistance and RSI accelerates upward from above 50. Alternatively, enter when price pulls back to a rising trendline and forms a bullish candlestick pattern.
The central principle is that every rule must be quantifiable. “Sell when RSI crosses above 70” is executable; “exit when the market feels overheated” is not.
Step 3: Design Exit Rules and Money Management—Two Lines of Defense
Exit Rules: Take Profit and Stop Loss
Entry is not the finish line. Take-profit and stop-loss rules are the system's most important protective mechanisms.
Stop loss: Every trade must have a predefined maximum acceptable loss. Common methods include placing the stop below a key support level or limiting the loss to 1%–2% of account capital. This is the trader's seat belt.
Take profit: One method is to place the target at the next key resistance level with a minimum risk-reward ratio of 1:2. Another is to use a trailing stop so profits can continue growing while the trend persists. As the classic trading principle says, the objective is to let profits run.
Money Management: The Position-Sizing Formula
Risk limit per trade: The risk on each trade—the difference between the entry and stop-loss prices multiplied by the position size—should not exceed 1%–2% of total capital. Even after ten consecutive losses, the account would lose no more than 20%.
Position-size calculation: Position size = (account balance × risk percentage) ÷ (entry price − stop-loss price). For example, with a $10,000 account, 2% risk, and a stop 5% away, the capital allocated to the position is $10,000 × 2% ÷ 5% = $4,000.
Some quantitative strategies apply a more conservative threshold, such as limiting a single trade to no more than 60% of the available balance to guard against extreme market conditions.
Step 4: Backtest and Validate in Live Conditions
This is the critical step that separates an idea from a system.
Backtesting: Test the system on historical data and calculate metrics such as total return, Sharpe ratio, maximum drawdown, win rate, and profit-to-loss ratio. A proper backtest must include trading costs such as fees and slippage, avoid look-ahead bias, and evaluate the strategy separately in bull, bear, and ranging markets.
Paper-trading validation: After a successful backtest, run the system with a simulated account or a very small position for one to three months. This reveals execution issues, including whether slippage remains within expectations, the exchange API is stable, and execution delays are manageable.
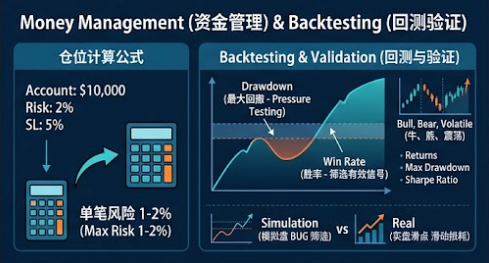
In one real case, a trader found 11 bugs during the first simulated test of a grid bot. After switching to live trading, the bot still failed because the exchange's minimum order size had not been considered. These are execution-layer problems that a paper strategy alone cannot reveal.
Common Trading-System Mistakes
Mistake 1: Pursuing a 100% win rate. No perfect system exists. A system with a 60% win rate can be profitable under sound risk controls, while a system with a 90% win rate may give back all its gains in a few losing trades.
Mistake 2: Assuming more complexity is always better. Empirical studies suggest that indicator confluence can improve results, but an overly complex system is prone to overfitting historical data and may perform poorly in live trading. Robust signal logic matters more than the number of indicators.
Mistake 3: Ignoring extreme market conditions. Black-swan events such as the 2022 Luna collapse caused many strategies that had performed well in trending markets to fail suddenly. Weak risk management and inadequate stress testing were the core problems. Consider adding a volatility filter or a circuit-breaker rule that pauses trading under extreme conditions.
Frequently Asked Questions (FAQ)
Q1: Which technical indicators should I use for my first trading system?
Start with one trend indicator and one momentum indicator, such as a moving average (MA/EMA) with RSI, or MACD with support and resistance. Two indicators are enough to form a basic system. Refine its parameters and rules gradually through backtesting instead of adding many indicators at once.
Q2: Why does my system lose money live after performing well in backtests?
Common causes include overfitting to specific patterns in historical data, omitting fees and slippage, changes in market structure between the backtest and live periods, and execution differences that prevent trades from filling at the ideal prices assumed by the backtest.
Q3: How much stop loss should I set?
There is no universal answer. Common approaches include a fixed-percentage stop, which keeps the loss on one trade below 1%–2% of capital, and a technical stop placed below a key support or resistance level. When combining the two, the tighter level can serve as the actual stop.
Related tutorials:
- Technical Analysis for Cryptocurrency: From Candlesticks to a Trading System
- The Complete Guide to Cryptocurrency Trading Strategies
- The Complete Futures Trading Guide: From Basics to Risk Control
- Futures Stop-Loss and Take-Profit Guide: An Essential Skill for Protecting Profits
- Futures Position Management: Kelly Criterion and Pyramiding
- Trading Journal Template: How to Review Every Trade Scientifically
- Cryptocurrency Trading Psychology: From Emotion Management to Discipline
Recommended reading:
Lettura consigliata
Visualizza altro


Service@hotcoin.com
Product@hotcoin.com
Business@hotcoin.com
Casecn@hotcoin.com