
Palladium Price: Live Trends, Historical Data and Key Drivers
Although both are platinum group metals, palladium and platinum can move very differently. Autocatalyst demand, supply disruptions and material substitution all give palladium prices their own characteristics.
When checking a live palladium price, confirm the latest data timestamp, the quotation unit and the price type at the same time. This article explains how to read trends and historical data and does not provide a fixed “today's price”; all examples are hypothetical and should not be treated as current market levels or trading commitments.
Key Takeaways
- The usual international quotation unit for palladium is USD per troy ounce, and the number must always be read together with its unit.
- Spot prices, benchmark prices, futures for a specific month and retail products may correspond to different prices.
- Historical trends should use a consistent source, contract and data processing method.
- Price direction does not equal holding returns; fees, leverage and contract rollovers all change the actual result.
What the Palladium Price Refers To
The chemical symbol for palladium is Pd, and the common international quotation is expressed in US dollars per troy ounce. The NYMEX standard palladium futures code is PA. Palladium is not another name for platinum, and similar names do not mean the same quotation can be used to value both.
When reviewing the palladium standard futures contract specifications, separate the quotation from the contract size: the standard contract code covered here is PA, with a contract size of 100 troy ounces. Micro contracts or products on other exchanges may differ and should not be applied directly.
How to Read Live Trends and Historical Data
First establish “which market, which product and which time”, then look at the price change. The latest traded price reflects the most recent transaction; bids and offers reflect current orders in different directions; the settlement price is a value formed under exchange rules. They can exist at the same time and do not have to be equal.
Intraday highs and lows should use the same trading session, and the comparison base for percentage changes should also be consistent. A trading day may differ from the calendar day in your region; prices shown while the market is closed may be the last traded or settlement value, and the presence of a number on the page does not mean it is still updating in real time.
When reading historical data, first confirm whether it refers to the same specific contract. Continuous futures charts link different months according to rules, and some also apply back-adjustment or spread adjustments. Therefore, a jump around a rollover does not necessarily mean the same holdable asset produced the same return in an instant.
| Data type | What it is useful for observing | What to verify when using it |
|---|---|---|
| Spot or spot assessment | Current physical market and reference prices | Location, quality, assessment time and method |
| Futures for a specific month | Price expectations for a particular delivery period | Contract month, expiry and trading depth |
| Continuous futures chart | Display of longer-term trends | Rollover rules and whether historical prices are adjusted |
| Retail or investment product | The quotation of the product you actually buy | Fees, premiums, leverage and subscription/redemption terms |
How to Convert Quotation Units and Amounts
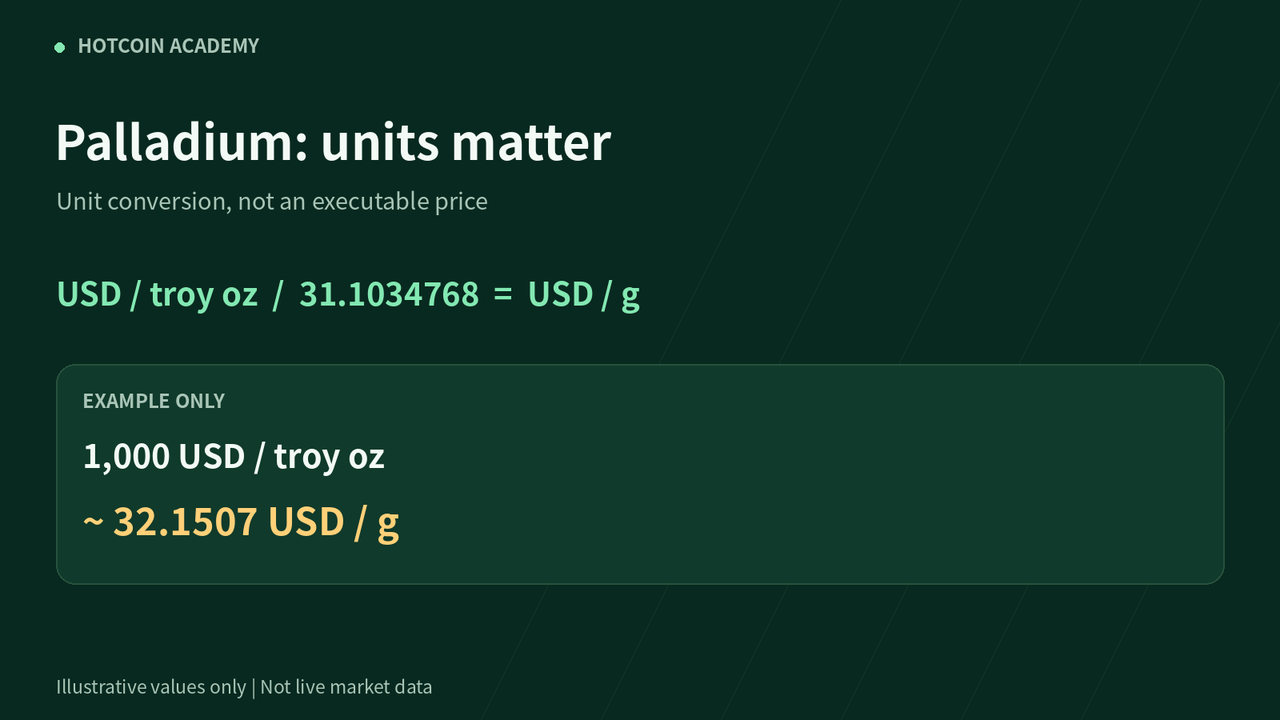
USD per troy ounce ÷ 31.1034768 = USD per gram.
Assuming palladium is USD 1,000 per troy ounce, the metal value per gram is approximately USD 32.1507. To convert into TWD or HKD, multiply by the corresponding foreign exchange quote per US dollar. All calculations are only for standardizing the basis and do not include the fees, premiums or taxes of actual products.
| Unit or basis | Meaning |
|---|---|
| 1 troy ounce | Approximately 31.1035 grams |
| 1 kilogram | 1,000 grams |
| Retail or buyback price | Purity, processing and the bid-ask spread still need to be confirmed |
If using a futures quotation to calculate the notional size of one contract, multiply the unit price by the contract's standard quantity. Margin is only the funding arrangement required to open and maintain a position; it does not replace the total contract value and is not a loss cap.
What Factors Affect the Palladium Price
Autocatalysts are one of the important uses of palladium. Vehicle production, powertrain mix and emissions requirements affect demand, while recycling and mine supply affect the quantity available. The impact of new energy vehicle penetration and substitution technologies on demand should be read together with vehicle models and actual material usage.
| Factor to watch | Link to price |
|---|---|
| Changes in the automotive industry | Also watch the mix of gasoline vehicles, hybrids and battery electric vehicles |
| Supply and recycling | Mine output, trade flows and recycling of end-of-life catalysts affect available quantity |
| Substitution and inventories | Platinum-palladium substitution is conditional, and inventory visibility also affects judgment |
You can also refer to the LBMA platinum and palladium benchmark information to further verify product information. When judging the market, especially distinguish between supply and demand changes that have already occurred and market expectations: data beating expectations and the data itself rising are not necessarily the same thing.
How Palladium Differs from Similar Products
The liquidity of the palladium market is not the same as that of gold. Bid-ask spreads, executable quantities and margin requirements all need to be confirmed separately. Larger price jumps may be related to positions and liquidity, and are not necessarily an instant change in physical demand.
Prices for different maturities may also show contango or backwardation. When holding futures or related products that need to be rolled, in addition to direction, also verify the rollover mechanism, financing and management fees; the spot price gain of the underlying cannot be directly copied as the product return.
Common Misconceptions
- Looking only at the price change and not the unit. The same price number can mean something completely different when converted to a different weight, energy or currency.
- Treating a historical curve as a directly realizable return. There may be rollover and cost differences between a continuous chart, a spot curve and a specific investment product.
- Predicting a certain rise or fall from a single piece of news. “A palladium crash means it has no industrial use” is a misconception. Prices also reflect prior expectations, inventories, substitution, capital positions and supply changes.
FAQ
Q1: Can palladium and platinum use the same quotation? No. Their chemical elements, use structures, supply and demand, and standard futures contracts are all different; when comparing price spreads, time, currency and weight units should also be aligned.
Q2: Why do palladium prices on two websites differ? First check whether they use the same market, spot or futures type, contract month, currency and update time; do not compare only the last decimal place on the screen.
Q3: Can the historical high be used directly as a future target? No. The historical high reflects the supply, demand, monetary and market conditions at that time, and may also belong to a different contract or data basis, so it cannot be guaranteed to recur.
Q4: The chart shows a rise, why has the product I bought not risen that much? The product may include different maturity exposure, leverage, exchange rates, management fees or rollover arrangements, and you need to read the documentation of the product you actually hold.
Q5: Is looking only at the palladium price enough to judge whether to buy? No. You also need to consider the specific product you buy, holding period, transaction costs, tolerable loss and exit conditions; a quotation cannot directly determine a position size suitable for you.
Conclusion
Understanding the palladium price starts with confirming the quotation object and unit. Verify the time basis of live data, the processing method of historical series and the costs of actual products before discussing trends, so as to avoid treating numbers from different markets as the same investment result.
Risk warning: This article is for educational and informational purposes only and does not constitute investment advice. Commodity prices may fluctuate significantly, and derivative leverage and delivery arrangements may bring additional risks; actual trading is subject to the rules of the relevant product.
Inirerekumendang pagbabasa
Tingnan ang higit pa