
Moving Average System Explained: Using MA and EMA to Identify Trends
Moving averages (MAs) are among the most fundamental trend tools in cryptocurrency technical analysis. By smoothing price data and filtering out short-term noise, they reveal the market's primary direction in a single line. The two most common forms are the simple moving average (SMA) and exponential moving average (EMA). An SMA treats every price in the calculation period equally, producing a smoother but slower line. An EMA assigns more weight to recent prices and reacts faster to price changes. Understanding their differences and applications is an important foundation for building an effective trading system.
SMA vs. EMA: The Key Difference Is Weighting
Simple Moving Average (SMA)
The SMA is the most straightforward form of moving average. It adds the closing prices from a specified period, such as 20 days, and divides the total by the number of periods to obtain an arithmetic mean. When new price data arrives, the oldest observation drops out, allowing the line to keep “moving.”
An SMA's defining feature is that every price receives exactly the same weight. A price from 20 days ago therefore has the same influence as yesterday's price. This property makes the SMA effective at describing long, stable trends: it is highly smooth and less likely to be distorted by a brief price spike.
Equal weighting also creates its main disadvantage: lag. Because older and newer prices are treated alike, an SMA tends to respond slowly when recent market sentiment changes.
Exponential Moving Average (EMA)
The EMA develops the SMA concept by assigning greater weight to more recent prices. The latest price changes have a stronger effect on the EMA, allowing it to reflect a change in market direction sooner than an SMA.
In the highly volatile cryptocurrency market, short-term traders often favor EMAs because they can identify a potential trend change earlier. The trade-off is that an EMA is more easily affected by short-term fluctuations and can generate more false signals.

Period Selection: When to Use Different Moving Averages
The selected period directly affects a moving average's sensitivity. A shorter period reacts faster but is more vulnerable to noise. A longer period reacts more slowly but generally provides a steadier view of the trend.
The following moving-average periods are widely used in cryptocurrency markets:
Short-term average (20 EMA): Its quick response helps short-term traders identify brief market swings. When price holds above the 20 EMA, short-term momentum is generally considered strong.
Medium-term average (50 EMA/SMA): Traders often regard it as a vital reference for the intermediate trend. When price pulls back to the 50 EMA and rebounds, they may treat the area as a potential entry point in the trend's direction.
Long-term average (200 EMA/SMA): The market frequently treats it as an important dividing line between bullish and bearish conditions. Price above the 200-day average suggests a broadly bullish trend, while price below it suggests a broadly bearish trend.
Three Practical Uses of Moving Averages
Identifying Trend Direction
This is the most basic and important function of a moving average. When price remains above an average and the average itself slopes upward, the market is generally in an uptrend. Conversely, when price stays below a downward-sloping average, the market is generally in a downtrend.
The core principle is straightforward: if the moving average slopes upward and price is above it, prioritize long opportunities. If the average slopes downward and price is below it, prioritize short opportunities.
Dynamic Support and Resistance
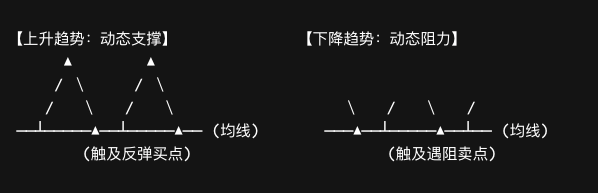
During an uptrend, moving averages, especially the 50-day and 200-day averages, often act as dynamic support. A pullback toward an average may attract buying interest and lead to a rebound. During a downtrend, a moving average may instead act as dynamic resistance.
This behavior gives traders a clear area to monitor. In an uptrend, a pullback to an average may offer a relatively lower-risk entry opportunity. In a downtrend, a rebound into an average may provide a reference area for looking for a short setup.
Golden Crosses and Death Crosses
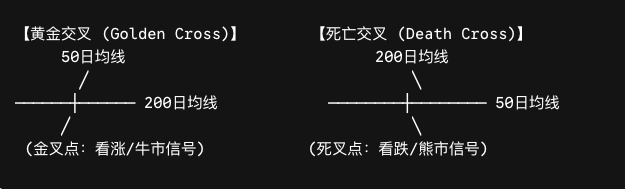
A golden cross occurs when a shorter-term moving average crosses above a longer-term moving average. It is commonly interpreted as a medium- to long-term bullish signal and may indicate that the market is entering a stronger phase. A death cross occurs when a shorter-term average crosses below a longer-term average and is commonly viewed as a medium- to long-term bearish signal.
The best-known pairing uses the 50-day and 200-day moving averages. In cryptocurrency markets, traders frequently monitor the 50/200 cross for signs of a transition between bullish and bearish trends.
⚠️ Note: In a sideways market, moving averages flatten and repeatedly cross price, producing many invalid signals. Avoid blindly chasing trades under these conditions.
Limitations and Practical Guidance
The main limitation of a moving average is that it is a lagging indicator. It always follows price and is better suited to confirming a trend than predicting where a trend will begin. By the time a golden cross appears, price may already have risen considerably, which means the buy signal can occur at a relatively high level.
No single “magic” moving average works in every market environment. A more rational approach is to use moving averages as a compass for the broader market context. Once they confirm a clear trend, combine that information with indicators such as RSI and MACD to look for specific opportunities in the trend's direction.
Frequently Asked Questions (FAQ)
Q1: Is SMA or EMA better, and which one should I use?
Neither is universally better; the choice depends on your trading style. An SMA is better suited to long-term trend analysis, such as using the 200-day SMA to assess bullish or bearish conditions. An EMA is more suitable for short-term trading, such as using the 20-day EMA to monitor momentum. Many experienced traders use both: a long-term SMA for the broader trend and a short-term EMA for potential entries.
Q2: Which periods should a beginner use?
A practical starting point is a three-line combination of the 20 EMA for the short term, 50 EMA for the medium term, and 200 EMA for the long term. Together, they cover short-, medium-, and long-term time horizons, helping beginners assess the broad direction while still observing near-term changes.
Q3: What are a golden cross and a death cross?
A golden cross forms when a short-term moving average crosses above a long-term average and is usually considered bullish. A death cross forms when the short-term average crosses below the long-term average and is usually considered bearish. The golden and death crosses between the 50-day and 200-day averages are among the most closely watched trend-transition signals in cryptocurrency markets.
Q4: Why are moving-average signals often inaccurate?
Moving averages are lagging indicators. They follow price and primarily confirm rather than predict trends. In a sideways market, averages cross price frequently and generate many invalid signals. Moving averages are therefore generally more effective in markets with a clear trend. Determine the trend direction first, then use the average as a reference for entries and exits instead of mechanically trading every crossover.
Related tutorials:
- Introduction to Cryptocurrency Technical Analysis: From Candlesticks to a Trading System
- Golden Cross and Death Cross: Practical Moving-Average Crossover Signals
- MACD Explained: Trend Following and Divergence Signals
- RSI Explained: A Practical Guide to Overbought and Oversold Conditions
- Support and Resistance: How to Find Key Price Zones
Recommended reading:
Inirerekumendang pagbabasa
Tingnan ang higit pa



Service@hotcoin.com
Product@hotcoin.com
Business@hotcoin.com
Casecn@hotcoin.com