
KDJ Stochastic Indicator: A Powerful Tool for Short-Term Trading
The KDJ stochastic indicator is one of the most responsive momentum tools used in short-term cryptocurrency trading. Its K, D, and J lines help traders identify overbought and oversold conditions, while golden crosses, death crosses, and divergences can highlight potential price turning points. KDJ evolved from the Stochastic Oscillator introduced by George Lane in the 1950s, adding the J line to respond more quickly to changes in market momentum. For day and swing traders seeking precise entries and exits in range-bound markets, KDJ can serve as a valuable short-term radar.
The Three KDJ Lines: Fast, Slow, and Ultra-Fast
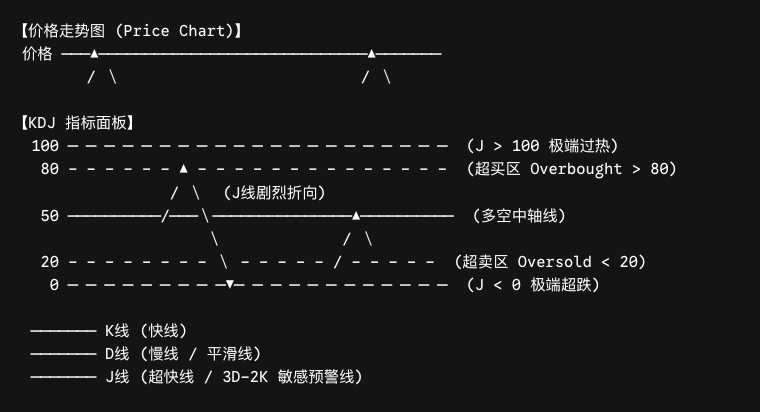
The KDJ indicator consists of three lines, each with a distinct role:
K line (fast line): The most responsive baseline measure, calculated from the highest price, lowest price, and closing price over a specified period. A reading near 100 means the price is near the top of its range and buyers are dominant, while a reading near 0 means the price is near the bottom and sellers are in control. It is useful for capturing short-term price movements.
D line (slow line): A smoothed version of the K line. Its steadier movement helps filter market noise and improve the reliability of trend assessment.
J line (ultra-fast line): The fastest confirmation line, calculated as 3D - 2K. Its wider swings may warn of market turning points earlier, but they also create more misleading signals, so the J line should be read together with the K and D lines.
Core Signals: Overbought and Oversold Levels, Crossovers, and Divergence
Overbought and Oversold Conditions
The most basic use of KDJ is identifying extreme market conditions.
In a strong one-way trend, KDJ may remain overbought or oversold for an extended period without a reversal. Signals based solely on these zones become less reliable in such conditions.
Golden Crosses and Death Crosses
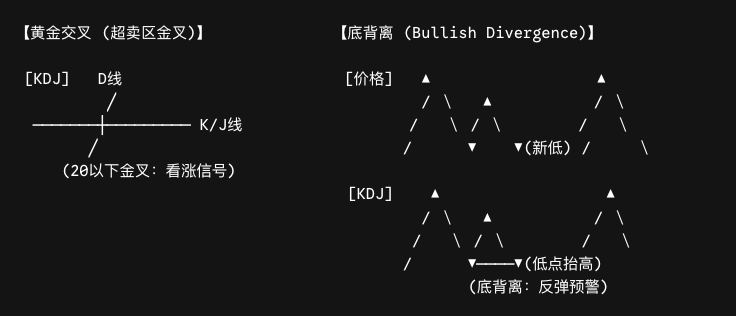
Golden cross (buy signal): The K and J lines cross upward through the D line, with all three lines turning higher. A crossover below 20 in the oversold zone is generally more reliable and may signal fading downside momentum and a possible rebound.
Death cross (sell signal): The K and J lines cross downward through the D line, with all three lines turning lower. A crossover above 80 in the overbought zone may indicate weakening upside momentum and growing pullback risk.
⚠️ Note: Crossovers can occur frequently in sideways markets and produce false signals. Use them together with an assessment of the broader trend.
Divergence: A Key Warning of Trend Reversal
Divergence is one of KDJ's most valuable trading signals and often provides more insight than a crossover alone:
Bearish divergence: Price reaches a new high, but successive KDJ peaks are lower. This suggests that bullish momentum is fading and the market may be approaching a top.
Bullish divergence: Price reaches a new low, but successive KDJ lows rise. This suggests that bearish momentum is weakening and the market may be approaching a bottom.
Practical tip: Confirmation across multiple indicators can significantly improve signal reliability. When a MACD trend confirmation appears together with a KDJ divergence, it creates a double confirmation. Historical data indicates that using the three together can correctly identify about 85% of market trends.
Trading Strategy: Combining KDJ with Bollinger Bands
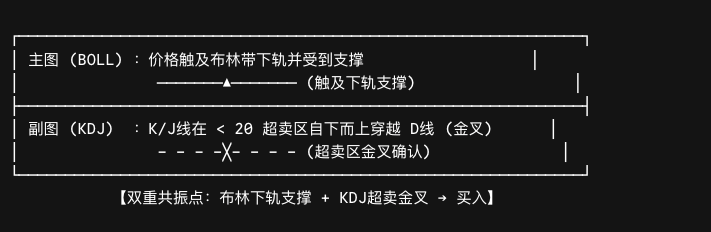
Combining KDJ with Bollinger Bands is a classic short-term trading approach:
When price reaches the lower Bollinger Band and KDJ forms a golden cross in the oversold zone (K < 20), a trader may consider testing a small long position.
When price reaches the upper Bollinger Band and KDJ forms a death cross in the overbought zone (K > 80), a trader may consider reducing exposure or opening a short position.
In a trending market, Bollinger Bands help confirm the direction of volatility and the price's location within the channel, while KDJ helps identify entries after pullbacks in the prevailing direction.
Four Limitations of KDJ
Lag: The K and D lines are derived from moving-average calculations and therefore lag price by design. They may miss part of a move in fast markets.
Poor reliability in strong trends: During a sustained one-way move, KDJ may repeatedly enter overbought or oversold territory and produce misleading crossovers. Mechanical execution can lead to premature exits.
No volume information: KDJ is calculated entirely from price data and does not reflect participation shown by trading volume. Signals supported by expanding volume are generally more reliable than those formed on low volume.
Parameter sensitivity: KDJ can behave very differently across periods and settings. The (9,3,3) and (6,3,3) configurations may generate different signals on the same chart, so parameters should be tested for each asset and timeframe.
Recommendation: KDJ is best suited to volatile range-bound markets or moderate trends. Start by using moving averages to determine the broader direction, then use KDJ to find entries during pullbacks with the trend and confirm them with volume. The default (9,3,3) parameters work in many situations, while short-term traders may adjust them to (6,3,3) for greater sensitivity.
Frequently Asked Questions (FAQ)
Q1: How does KDJ differ from RSI if both are oscillators?
KDJ is more sensitive and responds to price changes faster, particularly because the J line can issue early warnings of extreme conditions. This makes it more suitable for short-term trading. RSI provides a smoother view of relative strength, so the two indicators can complement each other: RSI confirms the broader overbought or oversold condition, while KDJ helps refine entry timing.
Q2: Does a golden cross in the oversold zone always mean it is time to buy?
No. A golden cross in the oversold zone is a signal worth monitoring, not a guarantee. In a strong downtrend, several golden crosses may occur while price continues to fall. Confirm the signal with MACD trend analysis and support levels.
Q3: What should I do when the J value rises above 100 or falls below 0?
A J value above 100 or below 0 reflects extreme market sentiment and may warn that a trend is approaching a reversal. However, the extreme reading itself is not a trading signal. Wait for the J value to turn back and for a K/D crossover to confirm the move rather than taking an immediate contrarian position.
Related tutorials:
Beginner's Guide to Cryptocurrency Technical Analysis: From Candlesticks to Trading Systems
Indicator Confluence Strategy: Trading with Multiple Confirmations
Recommended reading:
Inirerekumendang pagbabasa
Tingnan ang higit pa


Service@hotcoin.com
Product@hotcoin.com
Business@hotcoin.com
Casecn@hotcoin.com