
Classic Chart Patterns: Head and Shoulders, Double Tops, Triangles, and More
Classic chart patterns are visual expressions of market participants' collective psychology. By recognizing structural patterns left by price within a defined range, traders can assess the probability of a trend reversal or continuation. These patterns are among the oldest and most intuitive tools in technical analysis. Unlike candlestick patterns, they usually take weeks or even months to form, reflecting larger shifts in the balance between buyers and sellers rather than the short-term contest represented by one or a few candles.
Two Roles of Chart Patterns: Reversal and Continuation
Classic chart patterns fall mainly into two categories, each with a very different role in the market.
Reversal patterns appear near the end of a trend and suggest that the current trend may stop and move in the opposite direction. Common examples include head and shoulders tops or bottoms, double tops or bottoms, and rounding tops or bottoms.
Continuation patterns, also called consolidation patterns, appear in the middle of a trend. They show that the market is gathering momentum and that the original trend may resume after a short pause. All three triangle variants—symmetrical, ascending, and descending—belong to this category.
One core principle must be remembered when identifying a pattern: its broader market location matters more than the pattern itself. The same triangle appearing midway through an uptrend can have a completely different meaning and trading approach from one appearing midway through a downtrend.
Head and Shoulders Top and Bottom: The Classic Reversal Patterns
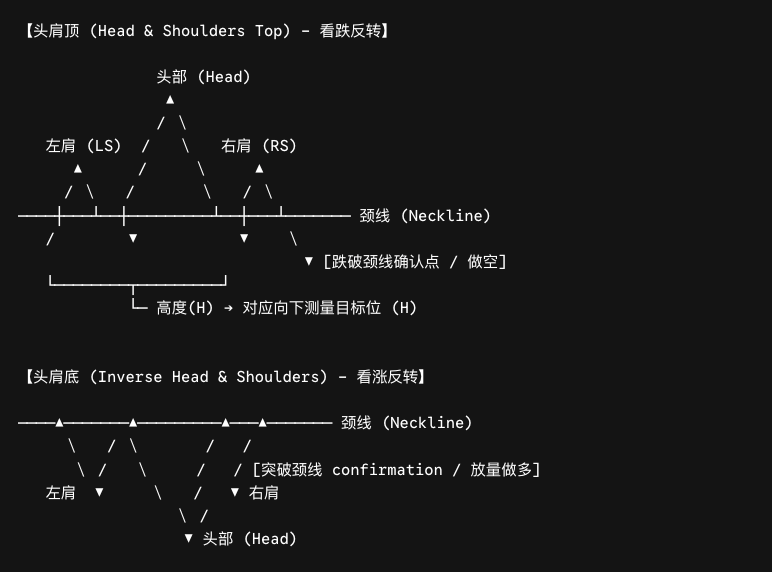
The Head and Shoulders Top is considered one of the most reliable topping reversal signals. Its structure consists of three consecutive peaks: the left shoulder, the head—the highest point—and the right shoulder, resembling a person's head and shoulders. A line connecting the low between the left shoulder and head with the low between the head and right shoulder forms the neckline, which serves as the pattern's confirmation line.
Key identification points:
- Left shoulder: The first peak forms during an uptrend, usually with relatively active volume.
- Head: Price rallies again to a higher peak, the highest of the three, while volume may begin to weaken.
- Right shoulder: The third rally is clearly weaker than the head, price fails to make a new high, and volume declines further.
- Confirmation: The pattern is confirmed when price breaks below the neckline.
The Inverted Head and Shoulders is the corresponding bottom pattern and looks like an upside-down head and shoulders top. Its volume profile is the reverse: volume may begin to increase as the head forms, and it usually expands significantly when the right shoulder is complete and price breaks above the neckline.
Practical tip: Two features can improve the reliability of a head and shoulders pattern. First, the left and right shoulders should be reasonably symmetrical. Second, volume should contract noticeably as the right shoulder of a top forms or expand noticeably as the right shoulder of a bottom forms. After a neckline breakout, the vertical distance from the head to the neckline is often used as a reference for estimating the first price target.
Double Top and Double Bottom: Reversals Confirmed by a Second Test
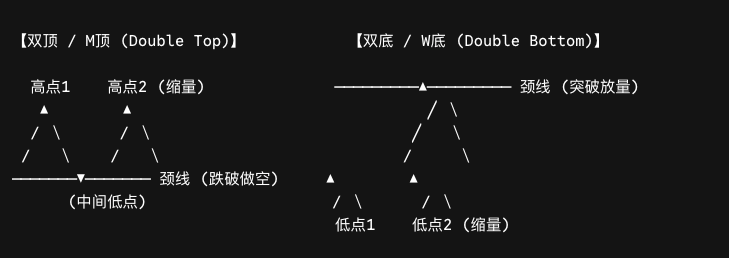
A Double Top resembles the letter “M.” Price tests the same resistance area twice but fails to break through both times, making it a classic bearish reversal signal.
Key identification points:
- Near the end of an uptrend, price encounters resistance and retreats twice around a similar level.
- The second peak is often slightly lower than the first, and trading volume also tends to decline.
- The lowest point between the two peaks forms the neckline.
- The pattern is confirmed when price breaks below the neckline.
A Double Bottom resembles the letter “W” and is the mirror image of a double top, suggesting that a downtrend may be ending. Lower volume as the second low forms and expanding volume when price breaks above the neckline provide important confirmation for a bullish trade.
Triangle Consolidations: Relay Stations Within a Trend
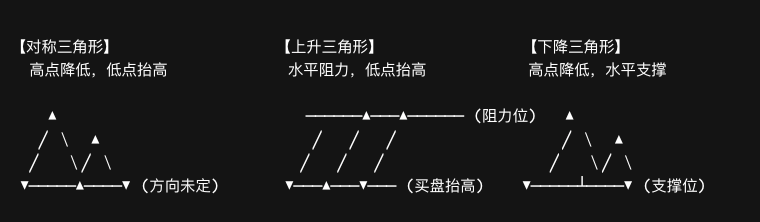
Triangle patterns are continuation consolidations. Price fluctuates between two converging trendlines before eventually choosing a breakout direction. However, different structures imply different breakout tendencies.
Symmetrical Triangle: The upper boundary slopes downward while the lower boundary slopes upward, and the two trendlines converge together. Buyers and sellers are temporarily balanced, so the direction is uncertain. The breakout direction cannot be determined in advance; price may break either upward or downward.
Ascending Triangle: The upper boundary is horizontal, representing a fixed zone of selling pressure, while the lower boundary slopes upward as buyers keep raising the lows. It is generally considered bullish, with a higher probability of price breaking above the horizontal resistance line.
Descending Triangle: The lower boundary is horizontal, representing fixed support, while the upper boundary slopes downward. It is generally considered bearish, with a higher probability of price breaking below the horizontal support line.
Trading rule: A genuine triangle breakout should occur around two-thirds of the way from the pattern's starting point to its endpoint, or apex, to have greater validity. If price only manages to break out near the apex, the signal is often false or lacks follow-through. An upside breakout should be supported by volume, whereas a downside breakout does not necessarily require it.
Three Disciplines for Trading Chart Patterns
Discipline 1: Do not trade an incomplete pattern. Whether it is a head and shoulders top or a double top, the pattern is only established after price makes a valid neckline break. Entering before that point is predictive trading and carries very high risk.
Discipline 2: Volume is the lifeblood of a pattern. The validity of a reversal pattern depends heavily on volume confirmation. An inverted head and shoulders breakout above the neckline after the right shoulder should occur on expanding volume, while lower volume at the second peak of a double top strengthens the signal.
Discipline 3: Define the stop-loss level. A stop for an inverted head and shoulders can be placed below the right shoulder low, while a stop for a head and shoulders top can be placed above the right shoulder high. A double-top stop can be placed above the second peak. Pattern trading seeks a favorable risk-to-reward ratio, and stop-loss discipline is essential to protecting an account.
⚠️ Note: Classic patterns are not a universal key. Academic research remains divided on the effectiveness of technical analysis, and some scholars argue that apparent success may result from data-mining bias. However, empirical research has also found that traders using chart patterns in early crypto markets, such as the Mt.Gox era, achieved significantly higher average returns. The key is to treat patterns as probability tools rather than deterministic signals and combine them with volume, trend analysis, and strict position management.
Frequently Asked Questions (FAQ)
Q1: Which is more reliable, a head and shoulders top or a double top?
Both are common reversal patterns, but their signal mechanisms differ. A head and shoulders top requires three peaks—the left shoulder, head, and right shoulder—and is usually accompanied by progressively weaker volume. It has more confirmation steps and can therefore be more robust. A double top needs only two peaks and forms more quickly. Head and shoulders patterns are generally considered stronger signals, but they are also harder to identify.
Q2: Does an ascending triangle always break upward?
No. Although an ascending triangle is considered bullish, no market rule is absolute. An upside breakout is more reliable when accompanied by expanding volume. If price breaks below the lower support line instead, the pattern may have failed and the original bullish view should be revised.
Q3: How can the breakout direction of a symmetrical triangle be determined?
A symmetrical triangle does not provide directional information by itself. The breakout direction depends on which side first disrupts the balance. In practice, traders should wait for a clear breakout—price moving through the upper or lower boundary with volume—before acting, rather than betting on direction beforehand. Breakouts near the triangle's apex often lack follow-through and may be false.
Q4: How is a pattern's price target calculated?
A common method projects the pattern's height. For a head and shoulders top, the vertical distance from the head to the neckline is used as a reference and projected downward from the neckline breakdown point. For an ascending triangle, the maximum vertical height—from the first low to the horizontal resistance line—is projected upward from the breakout. These are only estimation tools, not guaranteed targets.
Related tutorials:
- Technical Analysis for Crypto Beginners: From Candlesticks to a Trading System
- Common Candlestick Patterns and Trading Signals
- Support and Resistance: Finding Key Price Zones
- Volume Analysis: What Price-Volume Relationships Reveal
- How to Read Candlestick Charts: Your First Lesson
- MACD Explained: Trend Following and Divergence Signals
- RSI Guide: Applying Overbought and Oversold Signals
Recommended reading:
Inirerekumendang pagbabasa
Tingnan ang higit pa



Service@hotcoin.com
Product@hotcoin.com
Business@hotcoin.com
Casecn@hotcoin.com