
Amazon (AMZN) Stock Price | Live Chart, Market Cap & FAQ
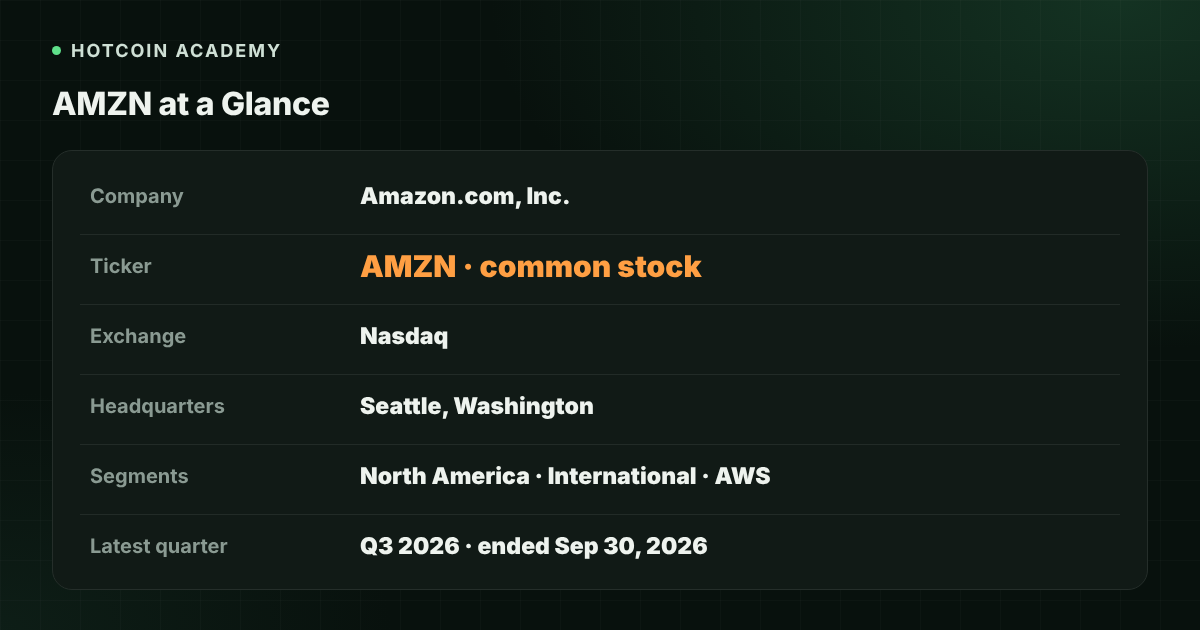
When people search for "AMZN stock price," most think of online shopping and logistics first, but Amazon is not just an e-commerce company. AMZN is the ticker for the common stock of Amazon.com, Inc., listed on Nasdaq.
The company currently reports results across three operating segments: North America, International, and Amazon Web Services (AWS). AWS is reported separately from the retail business, so investors should not view the entire company as a single e-commerce platform.
The live chart and market cap on the page are fed by the latest market data and will change with trading activity. Do not treat a snapshot at any given moment as a permanent conclusion.
Key Takeaways
- AMZN is the ticker for the common stock of Amazon.com, Inc. (Amazon), listed on Nasdaq.
- The company currently operates three reportable segments: North America, International, and AWS. AWS is an independent cloud services segment, so not all revenue should be viewed as retail sales.
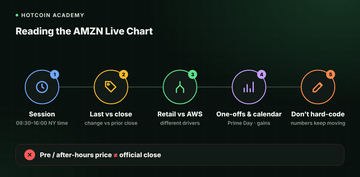
- The live chart reflects exchange trades. Regular trading hours are 9:30–16:00 New York time. Pre-market and after-hours prices are not the official closing price.
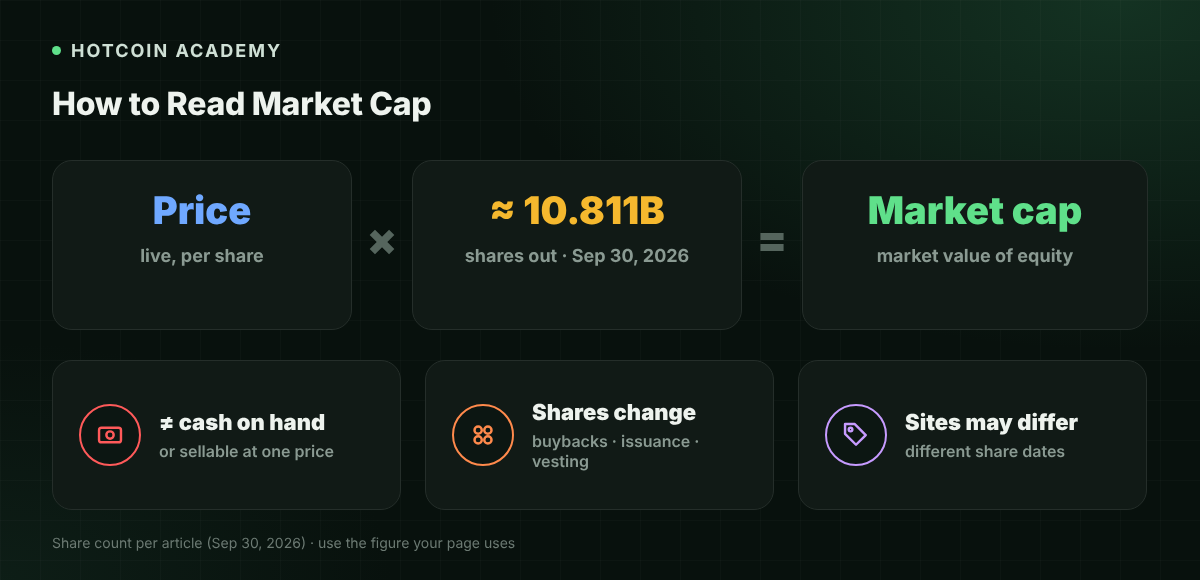
- Market cap is generally estimated as "stock price × shares outstanding." It is not cash on the company's balance sheet, nor does it mean all shares could be sold at the displayed price.
What is Amazon? Where is AMZN listed?
Amazon.com, Inc. is headquartered in Seattle, Washington, USA. Its business covers online retail, physical stores, third-party seller services, advertising, subscription memberships, and global cloud computing services (AWS), among others. The stock is listed on Nasdaq under the ticker AMZN. The company reports on a calendar-year basis.
| Item | Details |
|---|---|
| Company Name | Amazon.com, Inc. |
| Ticker | AMZN |
| Exchange | Nasdaq |
| Headquarters | Seattle, Washington, USA |
| Reporting Cycle | Calendar year |
| Latest Reported Quarter | Q3 2026, ended September 30, 2026 |
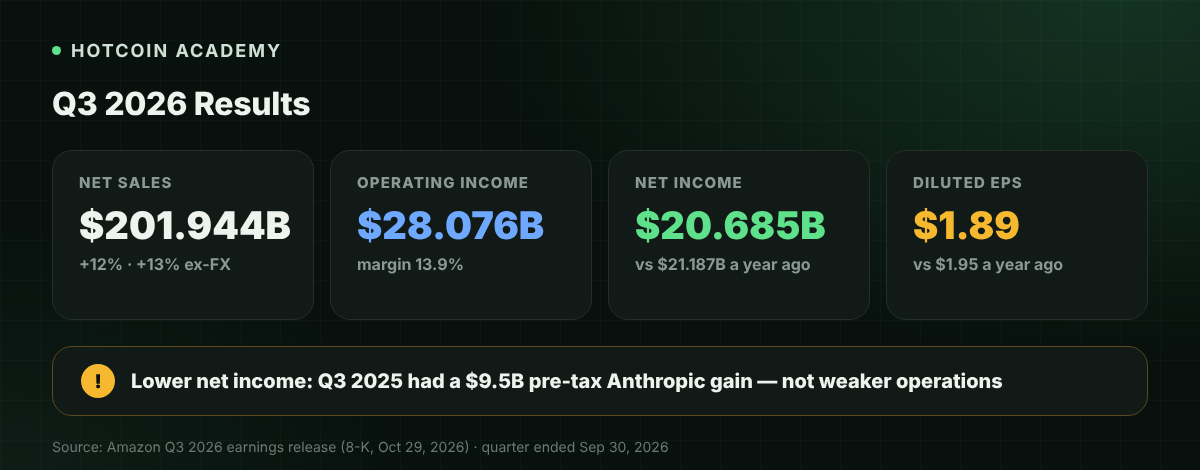
According to the Q3 2026 earnings release published on Amazon's Investor Relations website on October 29, 2026, net sales for the quarter were $201.944 billion, up 12% year over year; excluding approximately $900 million of unfavorable foreign exchange impact, growth was 13%. Operating income was $28.076 billion, with an operating margin of 13.9%; net income was $20.685 billion, and diluted earnings per share were $1.89. Net income was lower than the prior-year quarter's $21.187 billion, which the company mainly attributed to a $9.5 billion pre-tax gain related to its Anthropic investment recognized in non-operating income in Q3 2025, rather than a decline in operating income for the quarter. These figures come from the company's published release and will be updated in subsequent quarters; please refer to the latest filings.
When comparing year-over-year figures, also note calendar factors. The same release states that Prime Day in most major countries shifted to Q2 in 2026, whereas all Prime Day events fell in Q3 in 2025; excluding this timing shift, Q3 net sales growth would have been approximately 4 percentage points higher. This is background for understanding growth rates, not a judgment on future growth.
As of September 30, 2026, the company had approximately 10.811 billion shares of common stock outstanding. Future issuance or employee exercises will change this figure, and market cap calculations should use the share count adopted by the page at the time.
What businesses drive Amazon's revenue now?
In its Q3 2026 10-Q and earnings release, the company divides its operating segments into the following three categories:
| Segment | What it mainly includes | Q3 2026 Net Sales | Operating Income for the Quarter |
|---|---|---|---|
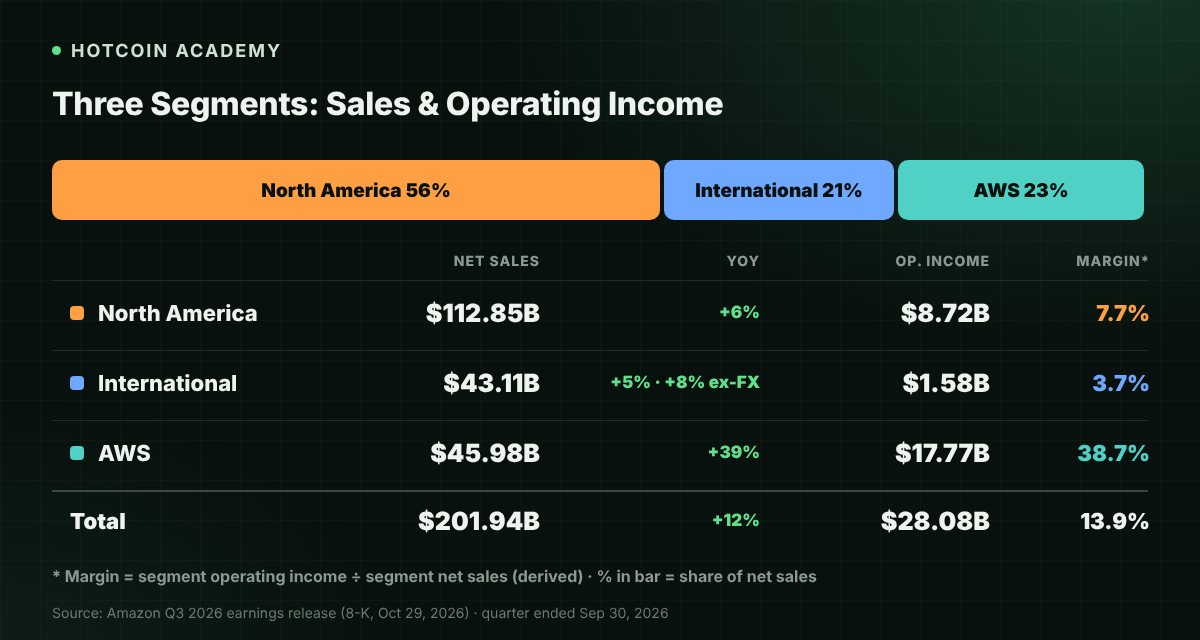
| North America | Retail (including third-party sellers), advertising, and subscription revenue from North American online and physical stores, including export sales from these stores | $112.852 billion, up 6% year over year | $8.723 billion |
| International | Retail (including third-party sellers), advertising, and subscription revenue from international online stores, including exports from these stores to other regions, but excluding exports from North American stores | $43.108 billion, up 5% year over year; up 8% excluding FX impact | $1.580 billion |
| AWS | Global compute, storage, database, and other cloud services for startups, large enterprises, government agencies, and academic institutions | $45.984 billion, up 39% year over year | $17.773 billion |
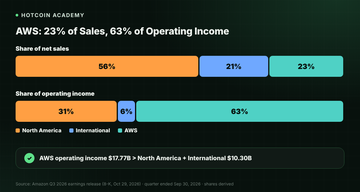
As shown, AWS net sales are already approaching the International segment, and its operating income exceeds the combined operating income of North America and International. Viewing Amazon as merely an e-commerce company underestimates the role of cloud services in its profit structure.
The same materials also provide supplementary breakdowns by revenue type, such as online stores, physical stores, third-party seller services, advertising, subscriptions, and AWS. This is another lens for observing net sales composition, existing alongside the three reportable segments rather than replacing them. Advertising, subscriptions, and third-party seller services are included in the North America or International segments, while AWS is a standalone segment. These classifications help understand revenue structure and cannot be directly converted into a "fair stock price."
How to read AMZN's live chart?
The "live chart" on a quote page generally comes from exchange trading data. Here are a few steps to read it:
- Confirm the time period: Regular U.S. trading hours are 9:30 to 16:00 New York time. The corresponding Beijing time differs by 12 or 13 hours depending on daylight saving time. Always rely on the time zone labeled on the page.
- Distinguish the latest price from the closing price: The latest price is the most recent trade price and changes continuously during the session. Percentage changes are usually calculated relative to the previous trading day's official close. Pre-market and after-hours trading tends to be thinner and should not be treated as a confirmed closing result.
- Look at retail and AWS separately: North America and International are more sensitive to consumer seasonality, promotional calendars, and exchange rates, while AWS reflects cloud service demand and capital expenditure cycles. Their growth rates and margins need not move in sync.
- Check for one-off or calendar factors in the reporting period: For example, which quarter Prime Day falls into, or whether non-operating investment gains significantly affected net income. Always compare against company filings before explaining year-over-year changes.
- Don't hard-code a snapshot: Stock prices change constantly. This section only explains how to read the chart; for specific numbers, see the live display on the page.
How to read market cap?
Market capitalization is generally estimated as follows:
Market cap ≈ current stock price × shares outstanding
The share count here depends on the methodology used by the quote page. The company states in its supplementary materials that as of September 30, 2026, approximately 10.811 billion shares of common stock were outstanding, but future issuance or employee exercises will change this figure. Calculations should use the share count adopted by the page at the time.
There are three common boundaries when reading market cap:
- Market cap is not cash on the company's balance sheet, nor does it equal the amount that would be received if all shares were sold at once at the displayed price.
- Stock price movements immediately change market cap; when share count changes, market cap and stock price may not move proportionally.
- Different websites may use different share dates or whether to include diluted shares, resulting in slightly different market caps. Rely on the notes of the page you are viewing.
Common Misconceptions
- "Amazon is just an e-commerce company": Retail and advertising are indeed important sources, but the company reports AWS as a standalone segment. In Q3 2026, AWS net sales were $45.984 billion and operating income was $17.773 billion, already one of the main components of its profit structure.
- "A decline in net income means retail or cloud is definitely weakening": Operating income for the quarter was actually higher than the prior-year period. The company explained that the year-over-year decline in net income was mainly because the prior-year quarter recognized a large investment gain in non-operating income.
- "The latest price I see is today's official closing price": Only the official closing price after regular trading hours is the benchmark typically used to calculate daily changes; pre-market and after-hours prices are from a different trading session.
FAQ
Q1: Which exchange is AMZN listed on? AMZN is the ticker for the common stock of Amazon.com, Inc., listed on Nasdaq, and the company is headquartered in Seattle, USA.
Q2: What business segments does Amazon have now? Is it only an e-commerce company? No. According to its Q3 2026 earnings release and 10-Q, the company reports business across three operating segments: North America, International, and AWS. North America and International mainly cover retail, advertising, and subscriptions, while AWS is an independent cloud services segment. Refer to the company's latest filings for specific details.
Q3: How should I interpret Amazon's latest quarterly results? For Q3 2026 (ended September 30, 2026), net sales were $201.944 billion, up 12% year over year; operating income was $28.076 billion; net income was $20.685 billion, and diluted EPS was $1.89. North America net sales were $112.852 billion, International was $43.108 billion, and AWS was $45.984 billion. When comparing year over year, also consider factors such as exchange rates and promotional calendars, and refer to the latest release.
Q4: How is AMZN's market cap calculated? It is generally calculated as current stock price multiplied by shares outstanding. Share count changes with issuance and employee exercises. The market cap on the page is calculated by the system based on data at the time, and the quote page display should prevail.
Q5: Can I tell whether AMZN is expensive just by looking at the stock price? No. Stock price alone does not account for share count, earnings composition, capital expenditure, or valuation levels. Even combined with market cap, you would still need to review financial data for North America, International, and AWS, as well as related risks. The current price cannot be treated as a conclusion that the stock is "cheap" or "expensive."
Conclusion
AMZN is the ticker for Amazon.com, Inc., listed on Nasdaq. When looking at this stock, first confirm that the company operates both North American and International retail-related businesses as well as the independent AWS cloud service, then review the segment results from the latest reported quarter, and return to the quote page to read the live price, percentage change, and market cap. These figures change with the market and should be based on the live display on the page and the company's latest releases.
If you see U.S. stock-related prices on a crypto platform or quote page, first clarify whether you are looking at listed company stock quotes, tokenized stocks, or other price-linked products. You can start by reading What Are Tokenized Stocks? How to Achieve 24/7 U.S. Stock Trading.
Risk Disclosure: This article is for educational and informational purposes only and does not constitute any investment advice or buy/sell recommendation. The financial figures cited come from the company's published financial reports or earnings releases and may be updated by subsequent filings. U.S. stock prices are highly volatile, and retail, advertising, and cloud services may be affected by consumer demand, exchange rates, competition, capital expenditure, and changes in the fair value of investment assets, potentially causing partial or total loss of principal. Please refer to the company's latest releases and the real-time data on your page, and make prudent decisions based on your own risk tolerance.
Inirerekumendang pagbabasa
Tingnan ang higit pa