
Volume Analysis: How Price-Volume Relationships Reveal Smart Money Activity
Volume is the force validator behind price action: price tells you where the market went, while volume tells you how many participants supported the move. In cryptocurrency trading, a price rise on expanding volume is more convincing than one on declining volume because more real capital has reached agreement at higher prices. By examining how volume and price interact, you can distinguish genuine trends from false breakouts, identify accumulation and distribution by major players, and avoid common breakout traps.
What Is Volume and How Do You Read It?
Volume is the total amount or value of a crypto asset actually traded during a specific period. On most trading platforms, it appears as a histogram below the candlestick chart. Each bar corresponds to the same period as the candlestick above it, and a taller bar indicates more active trading during that interval.
Practical tip: On the Hotcoin spot trading page, you can view the current pair's 24-hour volume, order book bids and asks, and real-time trade records. These are the most direct data sources for price-volume analysis.
Volume is usually measured in one of two ways: in token units, such as “500,000 ETH traded in the past 24 hours,” or in fiat/stablecoin value, such as “$1.5 billion in turnover.” Using both provides a fuller picture of market size.
Four Core Price-Volume Relationships
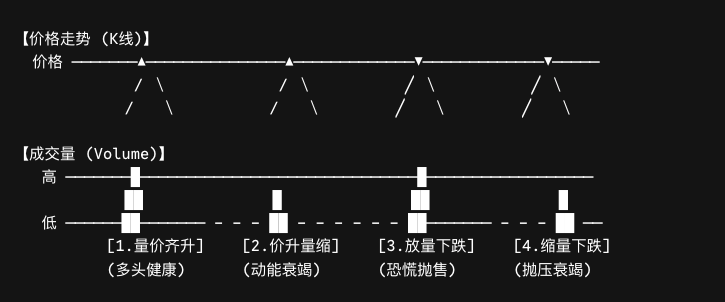
Understanding the interaction between volume and price is fundamental to technical analysis. The four most common combinations and their market implications are:
Price up, volume up: This is the healthiest bullish signal. Substantial capital is trading at higher prices, showing strong buyer participation and making the trend more credible. If volume continues to expand throughout an uptrend, continuation becomes more likely.
Price up, volume down: Bullish momentum may be weakening as participation declines. Such a rise is less likely to persist and is vulnerable to a pullback, so it calls for caution.
Price down, volume up: This is a strong selling signal. A large amount of supply is changing hands at lower prices, creating significant near-term downside pressure. If it occurs at elevated price levels, it may signal a trend reversal.
Price down, volume down: Selling pressure may be easing and downside momentum may be fading. However, declining price on declining volume is not a standalone reversal signal and should be confirmed with other indicators.
How to Identify a False Breakout with Price and Volume
A false breakout is a visual trap created when major players use price patterns to mislead the market. What looks like a sharp breakout on the candlestick chart may actually be an unsupported move produced by quickly pushing price through a key level.
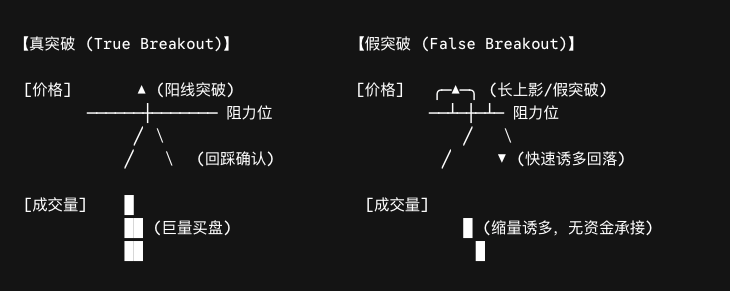
The key to spotting a false breakout is the volume at the moment of the move:
True breakout: Price breaks through a key resistance level on clearly expanding volume, and substantial bid support quickly forms after the breakout. This indicates broad capital acceptance of the move and makes the breakout more credible.
False breakout: Price crosses resistance, but the move lacks large buy orders and volume does not expand meaningfully. A sudden surge in sell orders may even appear. Without enough follow-through demand, price can quickly fall back.
Core principle: A breakout without committed capital is merely a chart pattern. Candlesticks tell us what happened, while volume helps explain why it happened. A breakout is worth following only when the two confirm each other.
Advanced: Using Wyckoff Price-Volume Analysis to Track Smart Money
The Wyckoff method is a systematic price-volume framework developed by early 20th-century trading pioneer Richard Wyckoff. It remains widely used to identify accumulation and distribution by smart money, meaning large institutional traders. Its three core laws are particularly useful for interpreting price-volume relationships:
Law of supply and demand: Price rises when demand exceeds supply and falls when supply exceeds demand. Volume is the most direct measure of the relative strength of supply and demand.
Law of cause and effect: The longer an accumulation or distribution phase lasts, the larger the subsequent price move can be. This helps explain why extended sideways consolidation often precedes a major move.
Law of effort versus result: Volume should confirm price action. Price-volume divergence, such as high volume with little price movement or a sharp rise on low volume, often appears near trend reversals or shifts in market sentiment.
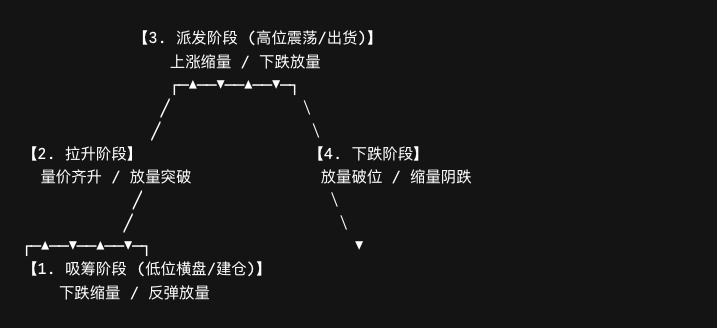
Wyckoff theory divides the market into four cyclical phases: accumulation, when major players quietly build positions at low prices → markup, when rising demand drives price higher → distribution, when major players gradually sell at elevated prices → markdown, when excess supply pushes price lower.
For beginners, the value of this framework is straightforward: avoid being shaken out during accumulation and avoid chasing price during distribution. Volume behaves differently in each phase. Accumulation often features declining volume on selloffs and expanding volume on rebounds, while distribution often features declining volume on rallies and expanding volume on declines.
Three Limitations of Volume Analysis
Wash trading: Crypto markets can contain artificially inflated volume. Some platforms or project teams buy and sell to themselves to create misleading activity. Using reputable exchanges and cross-checking data from several platforms can reduce this risk.
Differences in derivatives markets: Volume in futures and perpetual contracts does not have exactly the same meaning as spot-market volume. It should be assessed together with open interest.
Limits of a single signal: Volume is a supporting indicator, not a complete trading system. It should be combined with candlestick patterns, trend analysis, and other indicators rather than used alone for trading decisions.
Frequently Asked Questions (FAQ)
Q1: Does high volume always mean a trend is reliable?
No. High volume can accompany a steep decline, and whales can also manufacture activity. Volume must be interpreted together with price direction and location. A high-volume advance and a high-volume decline do not carry the same implications.
Q2: What does it mean when price rises while volume falls?
This is called price-volume divergence. It usually suggests that bullish momentum may be weakening as participation declines, making the advance less sustainable and increasing pullback risk. It is a warning sign rather than a reason to chase the rise.
Q3: How can volume reveal a false breakout?
A true breakout usually comes with clearly expanding volume and strong order support at the newly established price. A false breakout lacks volume confirmation, may show a surge in sell orders, and quickly reverses because follow-through demand is weak. Continuous large market buys at the breakout are an important confirmation signal.
Q4: Where can I find reliable real volume data?
Wash trading means that some smaller platforms may report unreliable volume. Use reputable mainstream exchanges, compare volume across several platforms, and prioritize spot-market data instead of relying only on derivatives volume.
Related tutorials:
Recommended reading:
Lectura recomendada
Ver más



Service@hotcoin.com
Product@hotcoin.com
Business@hotcoin.com
Casecn@hotcoin.com