
Applying Elliott Wave Theory to Crypto Markets
Elliott Wave Theory argues that market price movements are not random. Instead, they are driven by collective investor psychology and unfold in predictable, recurring patterns. American financial analyst Ralph Nelson Elliott developed the theory in the 1930s after studying stock markets in depth while recovering from illness and identifying distinct wave structures in price action. In crypto markets, where retail participation and emotional trading are especially prominent, the theory offers a distinctive—and controversial—framework for understanding how trends evolve.
The Eight-Wave Cycle: The Basic Unit of Market Movement
At the heart of Elliott Wave Theory is the idea that a complete market cycle contains eight waves divided into an impulsive phase and a corrective phase.
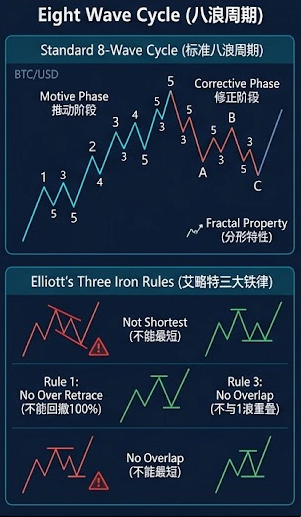
Impulsive phase (five-wave structure): moves in the direction of the primary trend and contains five waves—
Wave 1: The trend begins. It is usually triggered by positive news or a fundamental change. Only a small group of perceptive traders enters while most participants remain skeptical.
Wave 2: The first pullback. Early buyers take profits, causing the price to retreat, but it must never fall below the starting point of Wave 1. This is one of the core rules of wave counting.
Wave 3: The strongest advancing wave. This is usually the most powerful and longest-lasting wave in the structure. Many traders enter and volume rises substantially. Wave 3 must exceed the Wave 1 high and cannot be the shortest of Waves 1, 3, and 5.
Wave 4: The second correction. Price pulls back again but must not enter the price territory of Wave 1. This rule helps distinguish a genuine Wave 4 from the beginning of a new downtrend.
Wave 5: The final advance. This is the closing stage of the upward move. Market sentiment is often extremely optimistic, although momentum may already be weakening.
Corrective phase (three-wave structure): labeled A, B, and C, this is the countertrend move after the impulsive phase—
Wave A: The correction begins, although most participants still expect the primary trend to continue.
Wave B: A temporary recovery in the primary trend that often fails to exceed the Wave 5 high and can mislead investors.
Wave C: The final corrective wave, which is often forceful and marks the completion of the full eight-wave cycle.
The Three Core Rules: The Lifeline of Wave Counting
Every valid wave count must obey three non-negotiable rules. Breaking any one of them invalidates the count and requires a new analysis: Wave 2 cannot retrace beyond the start of Wave 1; Wave 3 cannot be the shortest of Waves 1, 3, and 5; and Wave 4 cannot enter the price territory of Wave 1.
Fibonacci: Measuring Wave Targets
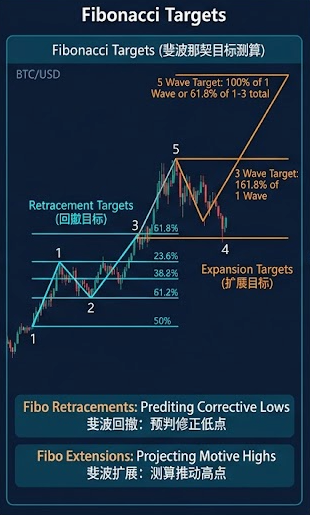
The wave structure provides the “road map,” while Fibonacci tools provide the “destination.” Combining the two creates a more complete analytical framework.
In practice, traders often use Fibonacci retracements to estimate where corrective waves may end. Wave 2 commonly retraces 50% or 61.8% of Wave 1, while Wave 4 tends to make a shallower retracement of roughly 23.6%-38.2% of Wave 3. If the price shows signs of stabilizing within an important Fibonacci zone, it may indicate a potential entry area.
Fibonacci extensions are used to estimate impulsive-wave targets. Wave 3 often reaches the 161.8% or 261.8% extension of Wave 1. Wave 5 is often similar in length to Wave 1 or reaches 61.8% of the total distance from Wave 1 through Wave 3.
Four Common Corrective-Wave Structures
Corrective waves do not always form simple straight-line pullbacks. Different market psychology can produce several structural patterns:
Zigzag: A sharp 5-3-5 structure that commonly appears in Wave 2 and often produces a deep pullback.
Flat: A sideways consolidation in which Waves A, B, and C have roughly similar ranges. It often appears in Wave 4.
Triangle: A five-subwave structure labeled A-B-C-D-E and bounded by converging or expanding trend lines. It usually appears in Wave 4 or Wave B.
Complex combination (WXY): A structure that joins multiple corrections into a longer sideways range.
Market Psychology: The Emotions Behind Each Wave
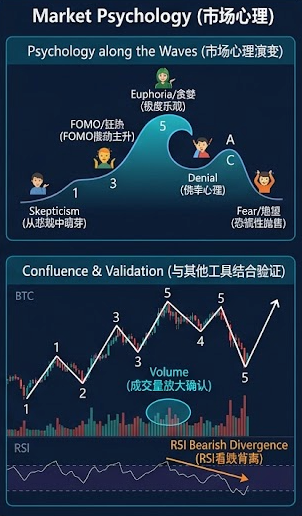
Elliott Wave Theory is closely tied to the psychology of market participants. Each wave corresponds to a particular form of collective sentiment, making the theory not only a technical tool but also a window into crowd behavior.
Wave 1: A trend emerges from pessimism, but very few participants believe a reversal has begun
Wave 3: Optimism spreads, and FOMO drives large-scale participation
Wave 5: Greed and euphoria dominate while sophisticated capital begins quietly exiting
Wave A: Denial and wishful thinking prevail as most participants view the decline as a temporary pullback
Wave C: Despair and fear take over, leaving the market dominated by pessimism
Challenges When Applying It to Crypto Markets
Crypto's high volatility and fragmented liquidity create unique challenges for wave analysis.
Subjectivity: Counting waves in real time depends heavily on the analyst's judgment. Different traders may produce entirely different counts from the same chart, making the method vulnerable to confirmation bias. An aggressive rally may be labeled the “start of Wave 3” when it is actually only a Wave B rebound within a complex correction.
Volatility noise: Sudden external events—such as regulatory changes, hacks, or macroeconomic shocks—can trigger extreme price moves in a short period. On lower time frames, these events can break an apparent wave structure and force analysts to discard their original counts.
Not a prediction tool: Wave theory is better at describing “where the market may be” than precisely predicting “where price will go.” In August 2026, some analysts used wave structures to identify the $70,000-$73,000 zone as a crucial decision area for Bitcoin, and price eventually tested that range. Even so, the example shows that wave analysis is more useful for identifying areas where price is likely to react than for producing a certain target.
Combining Elliott Waves with Other Tools
Wave analysis on its own is vulnerable to subjective interpretation. Experienced traders commonly seek confirmation from the following tools:
RSI and the Elliott Wave Oscillator (EWO): In an ideal five-wave impulse, the EWO should reach its highest reading at the peak of Wave 3. If price makes a new high in Wave 5 while RSI forms a lower high, a bearish divergence is present and may offer an early warning of fading momentum.
Volume analysis: Genuine impulsive waves usually come with expanding volume, while corrective waves should show a noticeable contraction in volume.
Frequently Asked Questions (FAQ)
Q1: Is Elliott Wave Theory suitable for crypto trading?
Yes, but it is difficult to apply. Because crypto markets have substantial retail participation and emotionally driven trading, clear wave structures may be more likely to form in theory. However, high volatility and sudden external events also make wave counting more difficult and subjective. It is best used as a tool for evaluating market position rather than as a precise forecasting system.
Q2: Which time frame should I use for wave counting?
It depends on your trading style. Waves are fractal, meaning the same structures can appear on both five-minute and weekly charts. A practical approach is to analyze multiple time frames: use daily or weekly charts to determine the primary trend, then use four-hour or one-hour charts to identify more precise entries.
Q3: Why are Elliott Waves and Fibonacci tools used together?
Wave analysis tells you “which stage the market is in,” while Fibonacci tools indicate “where specific targets may lie.” Together, they can turn a theoretical structure into an actionable trading plan: Fibonacci retracements help estimate the end of a correction, while Fibonacci extensions help calculate impulsive-wave targets.
Q4: How should a beginner start learning wave analysis?
Use a three-step process. First, learn the eight-wave structure and the three core rules, which form the framework of wave analysis. Next, study how Fibonacci tools interact with waves. Finally, observe the market psychology associated with each wave. Practice by reviewing historical charts before moving gradually into real-time analysis.
Related tutorials:
Crypto Technical Analysis for Beginners: From Candlesticks to a Trading System
RSI Explained: A Practical Guide to Overbought and Oversold Signals
Volume Analysis: How Price-Volume Relationships Reveal Market Activity
Recommended reading:
Lectura recomendada
Ver más


Service@hotcoin.com
Product@hotcoin.com
Business@hotcoin.com
Casecn@hotcoin.com