
RSI Relative Strength Index: An Overbought and Oversold Trading Guide
RSI, or the Relative Strength Index, is a momentum indicator that measures the speed and magnitude of price changes. It oscillates between 0 and 100 and helps traders determine whether a crypto asset is overbought or oversold. Developed by J. Welles Wilder in 1978, RSI is now one of the most widely used technical analysis tools in crypto trading. Its main value is that it condenses complex price-momentum data into a single oscillator, making it easier to identify moments of extreme market sentiment—whether excessive greed or panic selling.
How RSI Is Calculated
The standard RSI calculation uses the previous 14 periods, such as 14 days on a daily chart or 14 hours on an hourly chart. The formula is:
RSI = 100 − [100 / (1 + RS)]
Here, RS = average gain / average loss.
The calculation has two steps. First, calculate the average of all gains and the average of all losses over the selected period. Divide the former by the latter to obtain RS, then insert that value into the formula to calculate RSI. This formula keeps RSI within the 0–100 range, making it easier to compare momentum across assets and market conditions.
Most trading platforms calculate RSI automatically and display it beneath the price chart. You do not need to calculate it manually, but understanding the formula helps you interpret its signals correctly in different market environments.
How to Read RSI: Overbought and Oversold
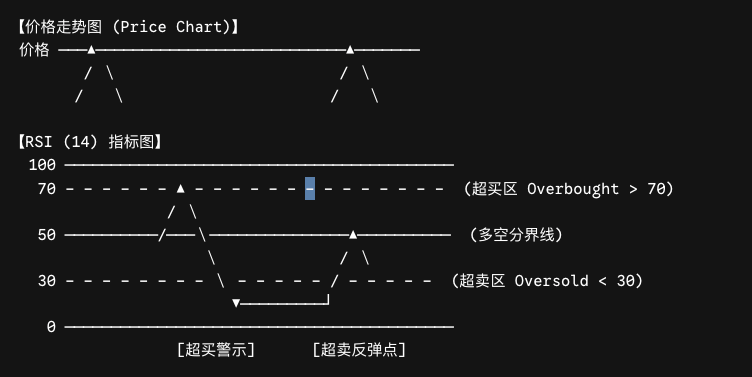
RSI is relatively straightforward to interpret. The key is to identify extreme market sentiment:
Overbought—RSI above 70: The asset may have risen too quickly in the short term, buyer momentum may be fading, and the price could face a pullback or consolidation. This can be a signal to consider taking profits or avoiding new long positions.
Oversold—RSI below 30: Selling pressure may be excessive, the asset could be undervalued, and market fear may have reached an extreme. The price may be approaching a rebound, making this a signal to watch for potential buying opportunities.
However, RSI can remain above 70 for an extended period during a strong uptrend without triggering a pullback. Likewise, it can stay below 30 throughout a severe downtrend. More aggressive traders may therefore adjust the thresholds to 80/20 or 75/25 to filter out noise in strongly trending markets.
The 50 level acts as a trend divider. RSI that remains above 50 indicates stronger bullish momentum, while sustained readings below 50 suggest that sellers are in control.
RSI Divergence: A Powerful Reversal Signal
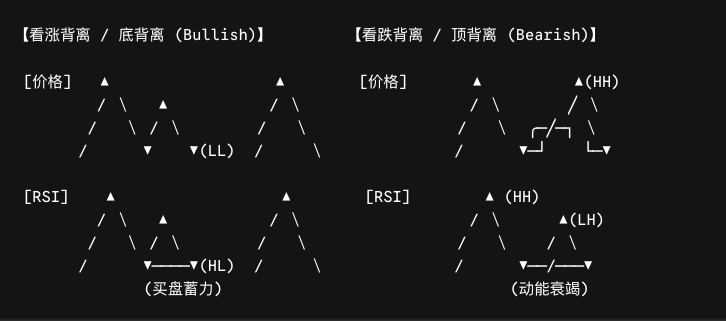
Divergence occurs when price and RSI move in opposite directions. It is generally considered more reliable than an overbought or oversold reading alone.
Bullish divergence: Price forms a lower low while RSI forms a higher low. Although the price is falling, selling momentum is weakening, suggesting that an upward reversal may be approaching.
Bearish divergence: Price forms a higher high while RSI forms a lower high. This indicates that the uptrend is losing internal momentum and may be approaching a correction or sharp decline.
Practical tip: In the highly volatile crypto market, RSI divergence often appears before a visible change in price and can provide an important early warning of a potential trend reversal.
Period Settings: Short-Term vs Long-Term
The default RSI period is 14, but it can be adjusted to suit your trading style. Short-term traders can use a shorter period for greater sensitivity, while long-term investors can extend the period to filter out market noise.
Practical Use: Combining RSI with MACD
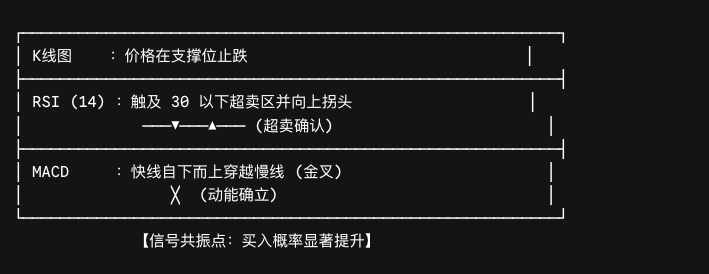
Every standalone indicator has limitations. In strongly trending markets, RSI can remain overbought or oversold for a long time, reducing the reliability of its signals. Experienced traders therefore often combine RSI with MACD. MACD helps identify trend direction and strength, while RSI highlights overbought and oversold conditions, allowing the two indicators to complement each other.
Three Limitations of RSI
It can fail in strong trends: In a powerful bull market, RSI may remain above 70 for a long time. Shorting solely because the market is “overbought” can lead to sustained losses.
It is a lagging indicator: RSI is calculated from historical prices, so it always reacts after real-time price changes.
It does not account for volume: RSI analyzes price but excludes trading volume. Signals supported by strong volume are generally more reliable.
Think of RSI as a speedometer rather than a navigation system. It can tell you whether the market is moving too quickly, but not which direction you should take. Determine direction with trend analysis, such as moving averages, and confirm signals with volume.
Frequently Asked Questions (FAQ)
Q1: Why is the default RSI period 14?
Wilder selected 14 after market testing during the development of RSI. It is generally considered a reasonable balance between sensitivity and stability and was subsequently adopted as the standard setting by major trading platforms.
Q2: Does overbought always mean the price will fall, and oversold always mean it will rise?
No. During a strong trend, RSI can remain overbought or oversold while price continues moving in the same direction. Overbought and oversold readings are warning signals, not execution signals. Confirm them with trend analysis and divergence signals before acting.
Q3: Are RSI divergence signals always accurate?
RSI divergence is a relatively strong technical signal, but it is not 100% accurate. After divergence appears, price may consolidate instead of reversing immediately, or several divergences may form before the trend actually changes. Confirm the signal with other indicators, such as MACD, and with support and resistance levels.
Q4: Which RSI period should beginners use?
Start with the default 14-period setting. Learn how to interpret overbought, oversold, and divergence signals first, then adjust the period to suit your short-term, swing, or long-term trading style.
Related tutorials:
- A Beginner’s Guide to Crypto Technical Analysis: From Candlesticks to Trading Systems
- MACD Explained: Trend Following and Divergence Signals
- Moving Averages Explained: Using MA and EMA to Identify Trends
- Support and Resistance: How to Find Key Price Zones
- Indicator Confluence Strategies: Trading with Multiple Confirmations
Recommended reading:
Recommended
View more



Service@hotcoin.com
Product@hotcoin.com
Business@hotcoin.com
Casecn@hotcoin.com