
MACD Explained: Trend Tracking and Divergence Signals
MACD (Moving Average Convergence Divergence) is one of the most comprehensive momentum indicators in cryptocurrency technical analysis, combining trend-following and momentum-measurement functions. Developed by Gerald Appel in the 1970s, MACD compares two exponential moving averages (EMAs) to help traders identify trend direction, gauge trend strength, and use divergence signals to spot early signs of a possible reversal. In the highly volatile crypto market, MACD is an essential tool for timing entries and exits.
The Three Core Components of MACD
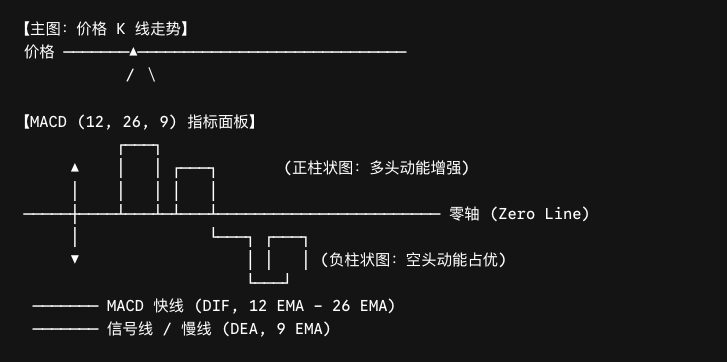
MACD appears in a separate panel below the main candlestick chart. Its three core components work together to provide a complete view of market momentum:
MACD line (fast line / DIF): Calculated by subtracting the 26-period EMA from the 12-period EMA, this line reflects the difference between short-term and long-term momentum. A positive MACD line means the short-term moving average is above the long-term moving average, indicating that bullish momentum is dominant; a negative reading indicates the opposite.
Signal line (slow line / DEA): The 9-period EMA of the MACD line itself. It smooths fluctuations in the MACD line, filters market noise, and provides clearer trade-trigger signals.
Histogram (BAR): A visual representation of the difference between the MACD line and the signal line. Bars above the zero line are positive (usually shown in green), while those below it are negative (usually shown in red). Lengthening bars indicate strengthening momentum, whereas shortening bars suggest that momentum is weakening.
How to Interpret MACD Signals
Golden and Death Crosses: The Most Basic Trading Signals
A golden cross occurs when the MACD line crosses above the signal line. It represents strengthening bullish momentum and is commonly viewed as a buy signal. A death cross occurs when the MACD line crosses below the signal line. It represents strengthening bearish momentum and is commonly viewed as a sell signal.
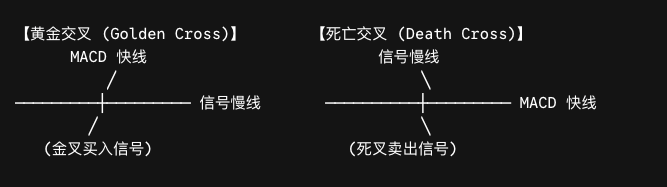
The strength of a crossover depends on where it occurs. A crossover above the zero line confirms continuation of a bullish trend and is generally more reliable. A crossover below the zero line may represent only an oversold rebound and requires further confirmation.
Zero-Line Crossovers: The Trend Divide
The MACD line crossing the zero line—where the 12-period EMA and 26-period EMA intersect—is an important reference for judging shifts between bullish and bearish market conditions. A move above zero signals a shift from bearish to bullish conditions; a move below zero signals the opposite.
The Histogram: The Pulse of Momentum
Changes in histogram height directly reflect whether momentum is accelerating or decelerating. When the bars continue to lengthen, momentum in the current direction is strengthening. When the bars begin to shorten, momentum is fading and the trend may be approaching a turning point. This can provide an earlier warning than a crossover signal.
MACD Divergence: A Key Signal for Spotting Trend Reversals
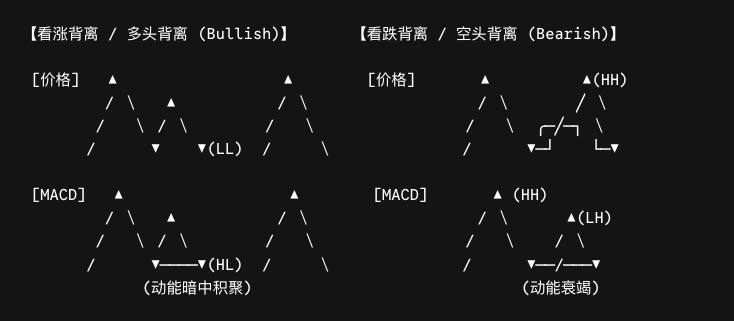
Divergence is one of the strongest and most practical patterns in MACD analysis. It occurs when price and the MACD indicator move in opposite directions, suggesting that momentum behind the current trend is becoming exhausted and that a reversal may be approaching.
Bullish divergence: Price makes a lower low, but MACD—usually the histogram or MACD line—makes a higher low. This shows that selling momentum is weakening even though price is still falling, while bullish strength is quietly building. It is a potential signal of an upward reversal.
Bearish divergence: Price makes a higher high, but MACD makes a lower high. This shows that although the uptrend is continuing, its underlying momentum has weakened and price may soon peak and turn lower.
Practical tip: Price does not necessarily reverse immediately after divergence appears. It may first consolidate or form a second divergence. Consider waiting for confirmation from a golden cross, death cross, or candlestick pattern before trading, and validate the setup against support and resistance levels before entering.
Advanced: Hidden Divergence as a Trend-Continuation Signal
Regular divergence points to a reversal, while hidden divergence points to trend continuation. Hidden bullish divergence appears during a pullback in an uptrend: price makes a higher low, but MACD makes a lower low. This suggests that the pullback may be temporary and the uptrend could continue. Hidden bearish divergence is the opposite and often appears during a rebound in a downtrend. Recognizing hidden divergence can help traders find opportunities to add to positions or enter in the direction of the prevailing trend.
MACD Limitations and Usage Tips
MACD also has important limitations:
Lag: MACD is calculated from moving averages, so it is inherently a lagging indicator. By the time a golden or death cross appears, price may already have moved considerably.
Poor performance in ranging markets: During sideways, choppy conditions, the MACD and signal lines may cross frequently and generate many false signals.
No volume input: MACD analyzes price only and does not account for trading volume. Signals supported by high volume are generally more reliable, so volume analysis should be used for additional confirmation.
Recommendation: MACD works best in markets with a clear trend. Use moving averages or trendlines to confirm whether the market has a defined direction, MACD crossovers to time entries and exits, and divergence to warn of potential reversals. Start with the default settings (12, 26, 9), then adjust them to your trading timeframe only after becoming familiar with the indicator.
Frequently Asked Questions (FAQ)
Q1: What do the default MACD settings of 12/26/9 mean?
The number 12 is the EMA period used for the fast MACD line, 26 is the period for the slow EMA, and 9 is the EMA period used for the signal line. Indicator creator Gerald Appel selected these settings based on traditional market cycles, and they are also suitable for most crypto markets.
Q2: Does price always rise after a golden cross?
No. A golden cross suggests that the trend may be turning bullish, but it is not a guaranteed signal. Golden crosses can occur frequently and fail repeatedly in ranging markets. Their reliability depends on market context: a golden cross within an uptrend is generally more reliable than one in a ranging or downtrending market.
Q3: Which is more reliable, MACD divergence or candlestick patterns?
Each has its advantages. MACD divergence is based on momentum data and can provide an early warning before price reverses, while candlestick patterns offer more specific information about price action and potential entry points. Many traders combine the two: they first use MACD divergence to identify a possible reversal direction, then use a candlestick pattern such as an engulfing pattern or morning star to confirm the entry.
Q4: Do shorter MACD histogram bars always mean the trend will reverse?
Shorter histogram bars indicate only that momentum is weakening; they do not guarantee a trend reversal. In a strong trend, the histogram may contract briefly and then expand again as the trend continues. Evaluate the positions of the MACD and signal lines, their location relative to the zero line, and the broader price structure together.
Related tutorials:
- Cryptocurrency Technical Analysis for Beginners: From Candlesticks to Trading Systems
- Moving Averages Explained: Using MA and EMA to Identify Trends
- RSI Explained: A Practical Guide to Overbought and Oversold Conditions
- Indicator Confluence Strategy: Trading with Multiple Confirmations
- Support and Resistance: How to Find Key Price Zones
Recommended reading:
Recommended
View more


Service@hotcoin.com
Product@hotcoin.com
Business@hotcoin.com
Casecn@hotcoin.com